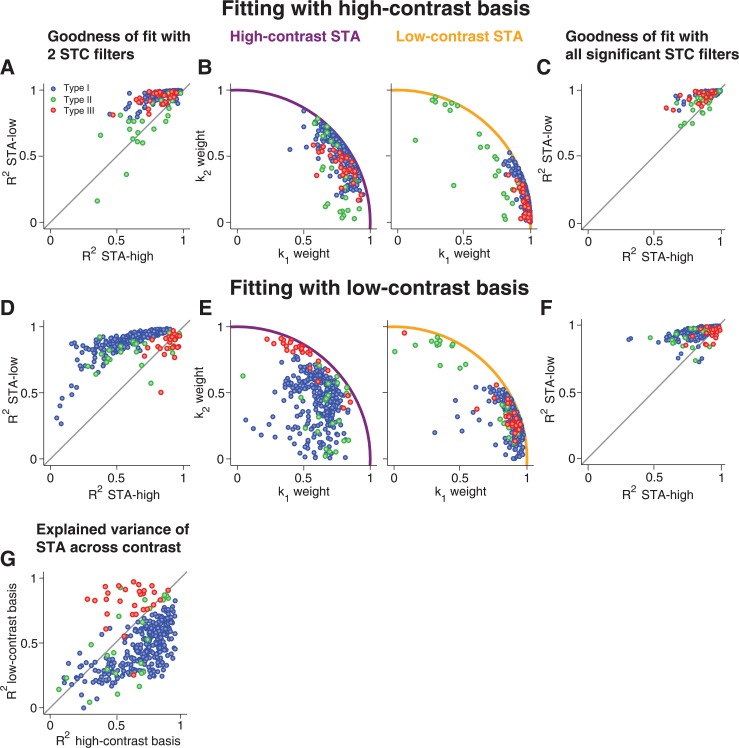
Fig 4. Population analysis of STA fits with STC-derived features.
(A) Assessment of fit quality by the coefficient of determination R 2 for fitting high-contrast and low-contrast STAs with the high-contrast-derived features. The gray line marks identity. (B) Weights of k 1 and k 2 obtained from fitting the high-contrast STAs (left) and low-contrast STAs (right) by high-contrast-derived features. The colored lines mark the unit circle, which is a bound for the weights. (C) Same as (A), but using for each cell all features obtained as significant from the high-contrast STC analysis. (D-F) Same as (A-C), but based on the low-contrast-derived features for fitting the STAs. (G) Comparison of how much of the contrast-induced variation of the STAs were captured by the two-feature basis obtained from either high contrast or low contrast. This was quantified by the coefficient of determination, R 2, for the difference of the fitted STAs.

