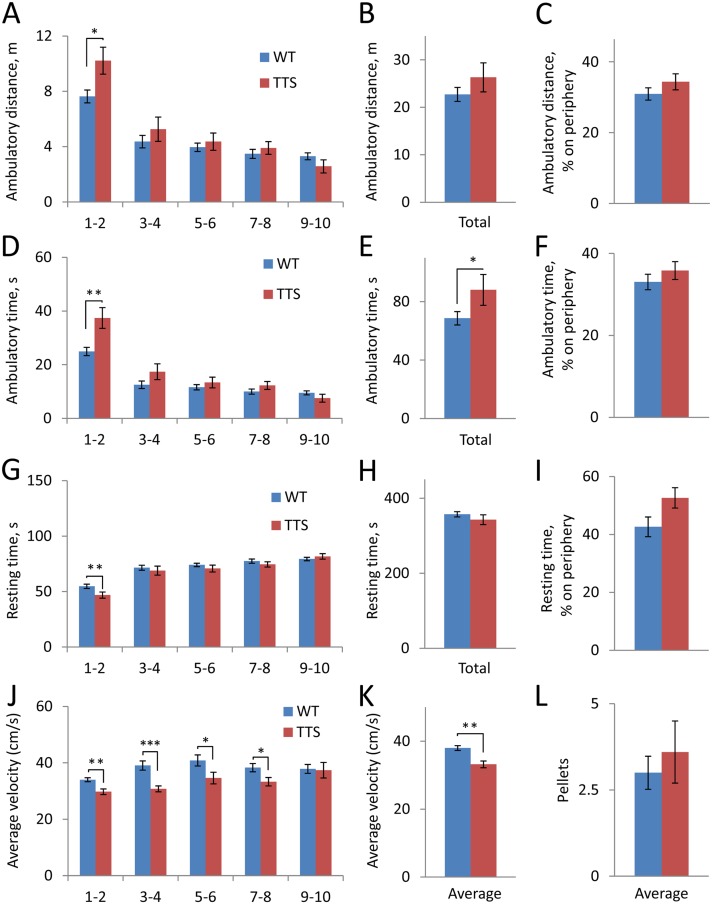
Fig 2. Spontaneous locomotor activity.
A-C: Ambulatory distance; D-F: Ambulatory time; G-I: Resting time; J-K: Average velocity. The values averaged for 2-min sequential periods (A, D, G, J) and for the total 10-min testing period (B, E, H, K) are shown. Also, the percentage of distance and time on the arena periphery (C, F, I) are shown. L: Number of pellets dropped during the test. All results are mean ± SEM. Number of mice examined: WT = 22; TTS = 12. *p < 0.05, **p < 0.01, and ***p<0.001, significantly different from WT mice.

