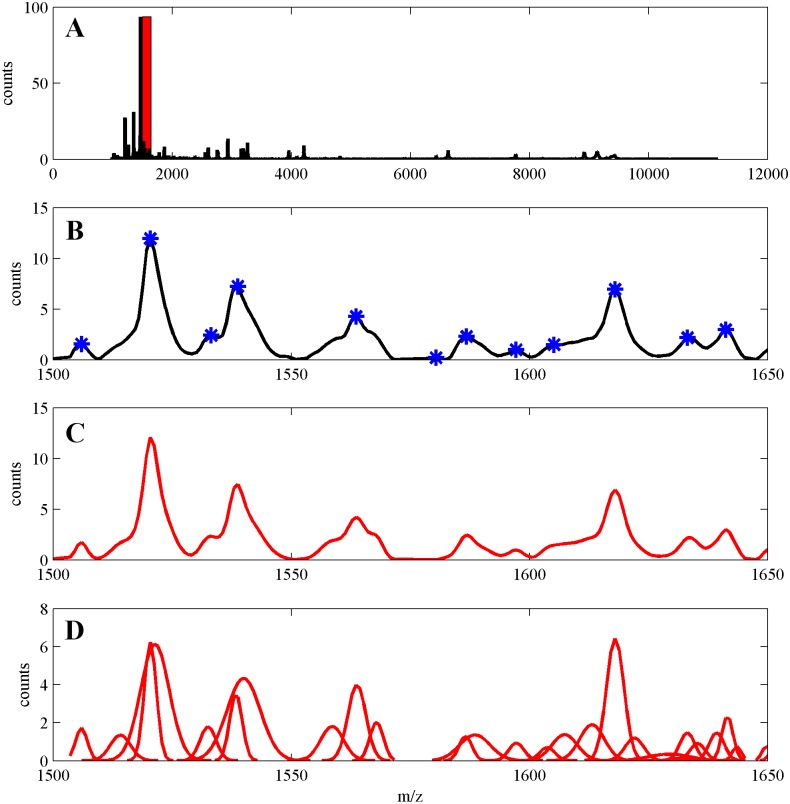
Fig 7.
(A) Whole average MS corresponding to the serum peptidome for the data in [25]. Small fragment of this MS, within the range 1500–1650 Da is highlighted by a red rectangle. (B) Zoomed out fragment 1500–1650 Da of the MS. Peaks detected by using the CWT algorithm are marked by blue asterisks, (C) GMM signal of the fragment (red), (D) GMM components (red).

