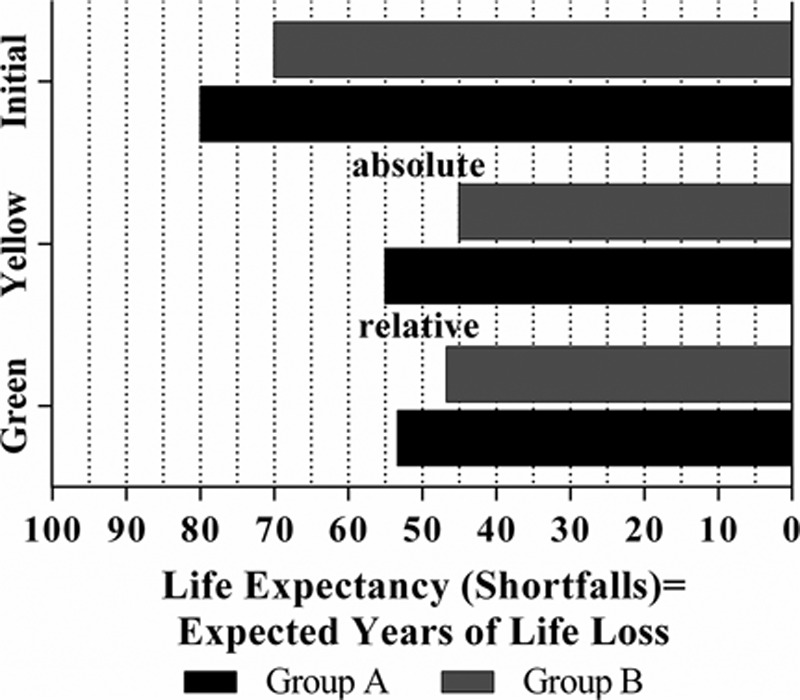
FIGURE 2.

A shortfall version of Asada’s hypothetical experiment. This figure illustrates an extension of Asada’s original experiments from Figure 1. The bars represent the initial distribution, and the outcomes of the yellow and green pills in terms of shortfalls of life expectancy (instead of attainments), assuming that life expectancy is bounded at 100. The yellow pill increases life expectancy uniformly, whereas the green pill increases life expectancy by proportionally decreasing the shortfall of life expectancy (or years of life lost). For the yellow pill, the absolute difference between the two groups is constant at 10, whereas the shortfall ratio increases from 1.14 to 1.22. For the green pill, the absolute difference decreases to 6.67, whereas the shortfall ratio is constant at 1.14.
