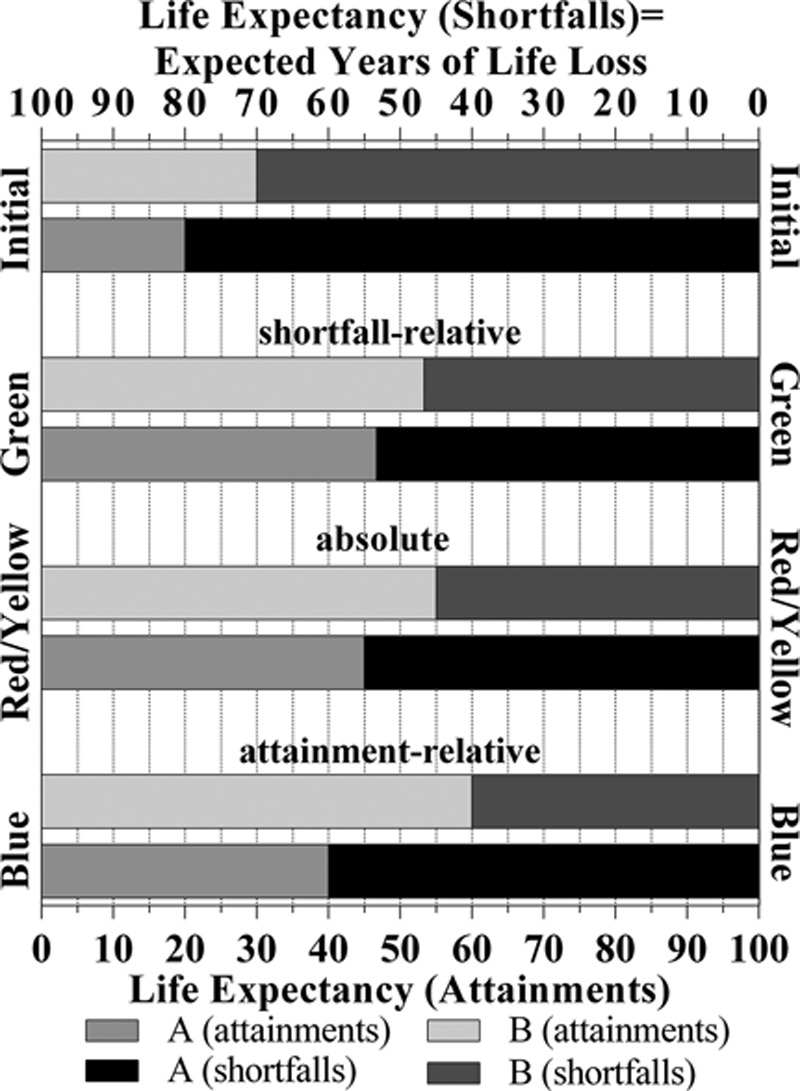
FIGURE 3.

The hypothetical experiments represented as shortfalls and attainments. This figure illustrates both Asada’s original experiments from Figure 1 and the extended experiment from Figure 2 in the same graph. The bars represent the initial distribution and the outcomes of each of the pills in attainments and matching shortfalls. Any pill induces the same increase in average life expectancy, but the increase is distributed differently in the population. The different ways to distribute the total increase may be interpreted as the inequality equivalence criteria of the different indices.
