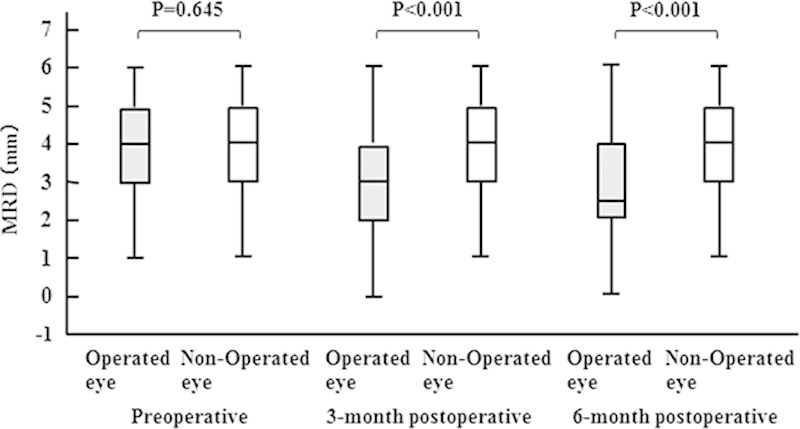
FIGURE 1.

Box-and-whisker plots showing the distribution profiles of MRD measured before and after operation. The box encloses the 25th to 75th percentile of the data; whiskers define lowest and highest observation. The line through the box is the median. Outlier points are not shown. MRD indicates margin reflex distance.
