FIGURE 3.

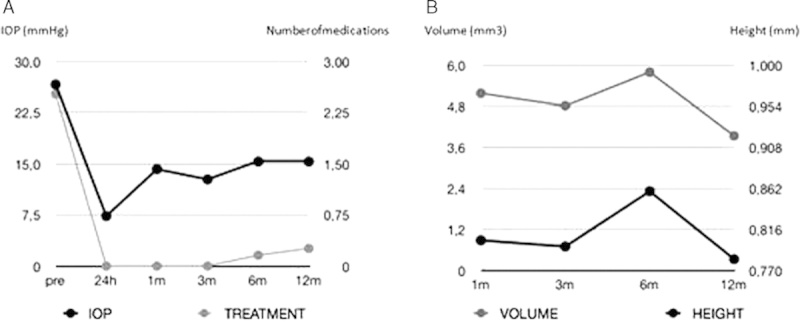
A, Mean changes in intraocular pressure (IOP) and number of medications (treatment). B, Mean changes in volume and height of the intrascleral lake.

A, Mean changes in intraocular pressure (IOP) and number of medications (treatment). B, Mean changes in volume and height of the intrascleral lake.