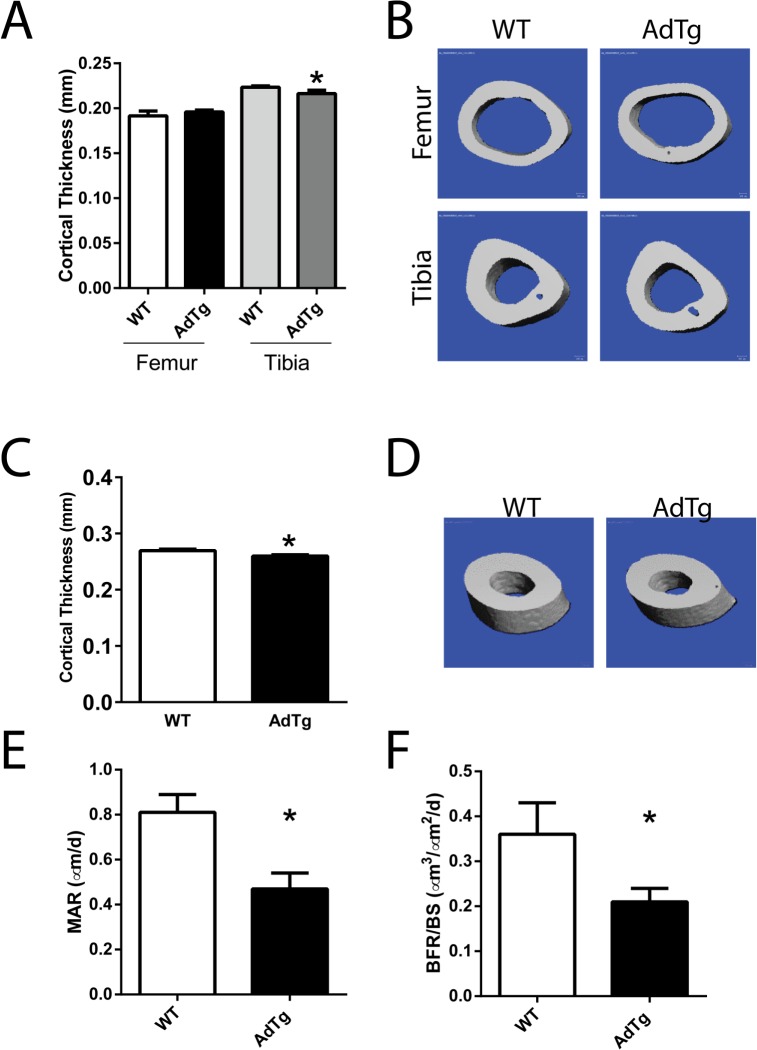
Fig 2. Cortical bone parameters of the midshaft of femurs and tibia and histomorphometry.
A) μCT and B) three-dimensional reconstruction μCT renderings. C) Cortical thickness assessed at the Tibiofibular junction (TFJ) and D) three-dimensional reconstruction μCT renderings of the (TFJ). E) Mineral apposition rates and F) bone formation rates measured by dynamic histomorphometry at the proximal tibia. All data are shown as mean ± SEM from 12 week old female mice (n = 5–8). Statistical significance * P<0.05, WT compared with AdTg bones.

