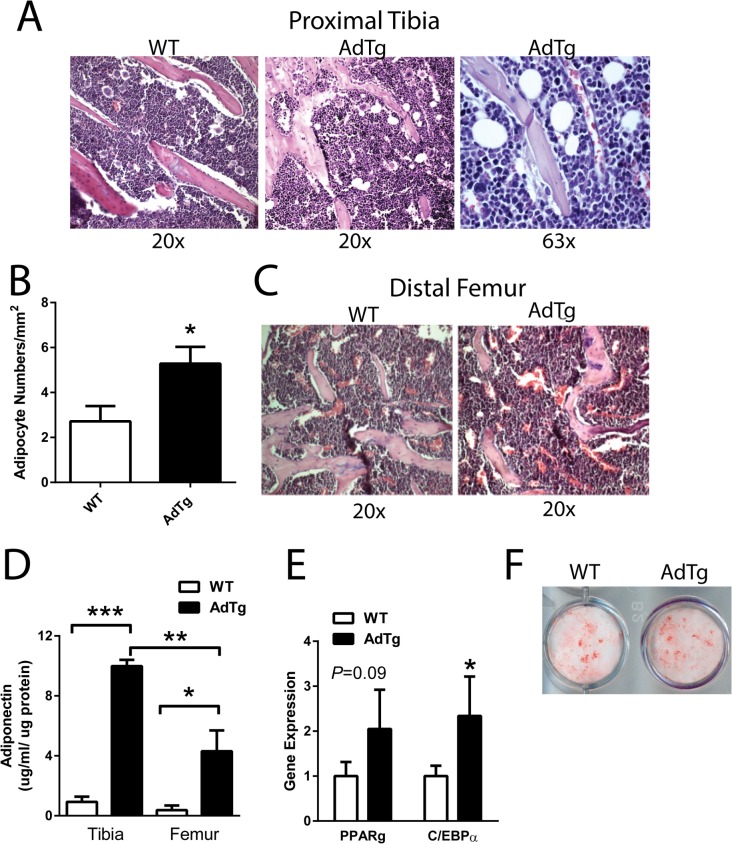
Fig 3. Effects of adiponectin on adipogenesis.
Hemotoxylin and Eosin (H & E) staining of A) proximal tibia and B) number of adipocytes measured to be ≤ 10 μm from trabeculi. C) H & E staining of distal femur. D) Adiponectin concentration measured in the marrow from tibia and femurs. E) Expression level of the adipocyte marker genes: peroxisome proliferator-activated receptor gamma (PPARγ) and CCAAT/enhancer-binding protein alpha (C/ebpα). Assessment of adipogenesis F) by Oil Red O staining, from BMSCs isolated from the tibia of WT and AdTg mice. All expression data were obtained by RT-qPCR analysis of RNA and calculated based on the ddCt method with GAPDH as the reference gene and WT as the control. All data are shown as mean ± SEM from 12 week old female mice (n = 3–6). Statistical significance * P<0.05, WT compared with AdTg bones.

