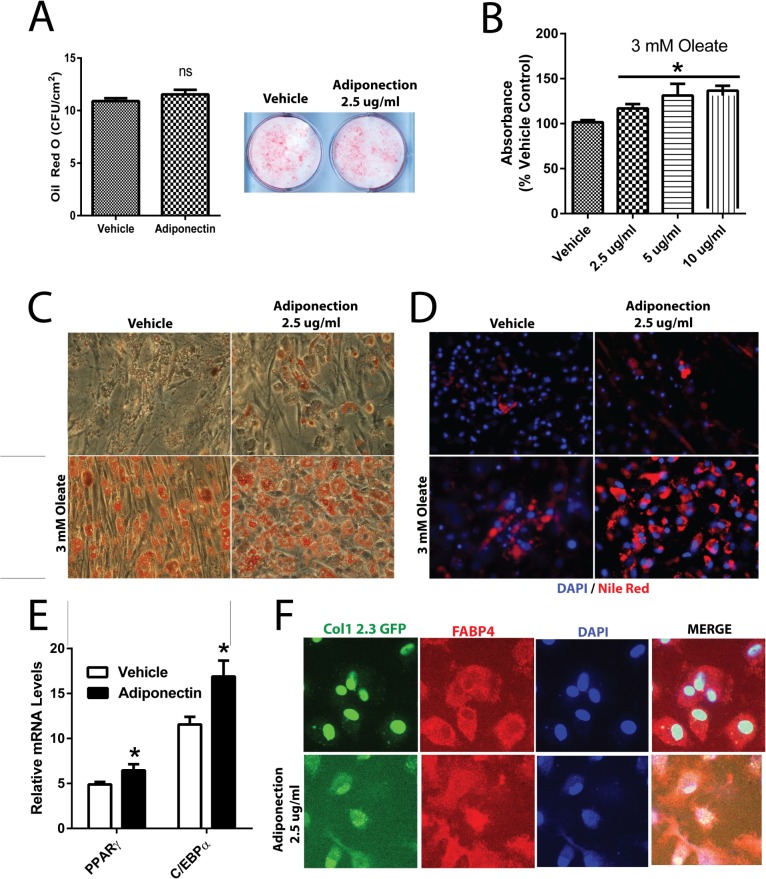
Fig 5. Effects of Adiponectin on adipogenesis.
A) Effect of adiponectin treatment (2.5 μg/ml) from day 0–5 on adipogenic differentiation from BMSCs as assessed by Oil Red O staining. Effect of adiponectin treatment (2.5 μg/ml) from day 14–28 on adipogenesis as assessed by B) quantification and C) visualization of Oil Red O staining of adipocyte-like cell colonies and D) Nile Red staining with or without 3 mM oleate. Red staining represents lipid droplets and blue staining represents DAPI stained nuclei. E) Expression level of the adipocyte marker genes Pparg and C/ebp alpha. F) Co-localization studies of BMSCs isolated from Col-1 2.3 promoter driven GFP reporter mice treated with 2.5 μg/ml of adiponectin in adipogenic media from day 14–21 following osteoblastic differentiation for 7 days. Green staining represents osteoblast lineage cells, red staining indicates adipogenic marker FABP4, and blue staining indicates DAPI stained nuclei. Cells were visualized with a spinning disk confocal microscope. Colony numbers were calculated using Image J Software. All expression data were obtained by RT-qPCR analysis of RNA and GAPDH as the relative control. All data are shown as mean ± SEM from BMSCs isolated from 12 week old WT mice (n = 3–7). Statistical significance * P<0.05.

