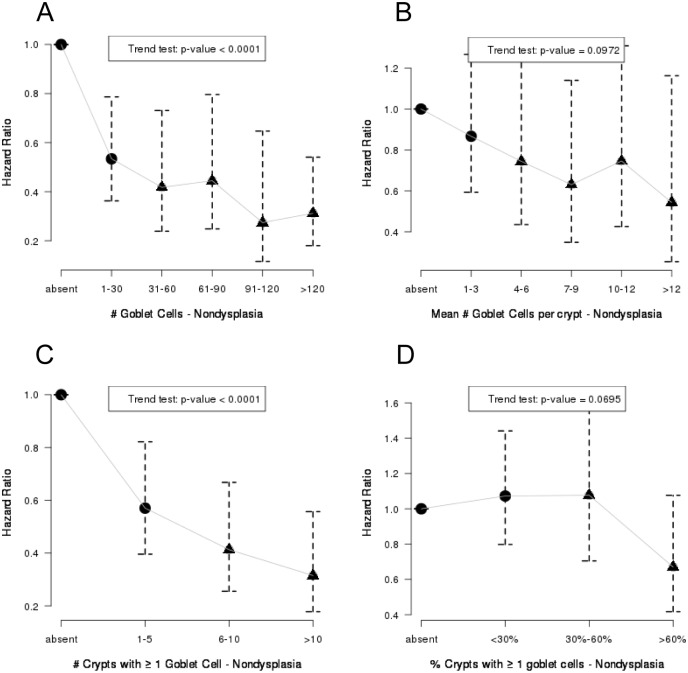
Fig 2. Goblet Cell Counts and Risk of Adenocarcinoma (Hazard Ratios).
Association between # GC (A), mean #GC/crypt (B), # crypts with ≥ 1 GC (C) and proportion of crypts with ≥ 1GC (D), in non-dysplastic biopsies from patients with BE, and progression to adenocarcinoma was modeled using Cox regression on a per biopsy basis clustered by patient and adjusted for patient age, sex and BE length. The p-values were determined from the log rank test comparison between the biopsies from the categories indicated by a circle with those indicated by a triangle.

