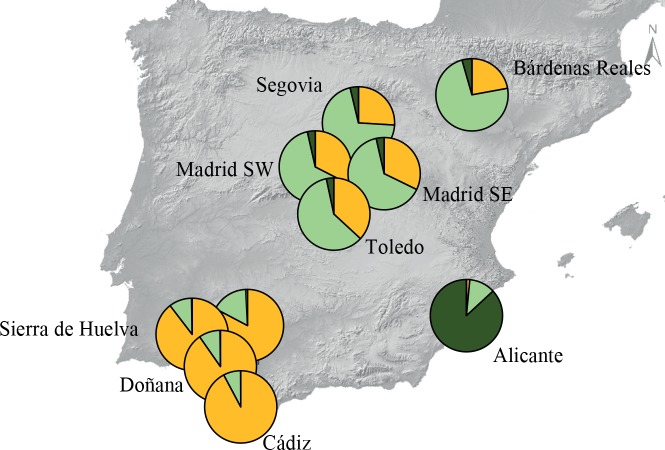
Fig 3. Spatial clustering analysis in Geneland.
The number of inferred clusters was fixed to three, as this represents the most supported value of K. The admixture proportions for each studied subpopulation were represented using pie charts, with each colour indicating a different genotypic cluster.

