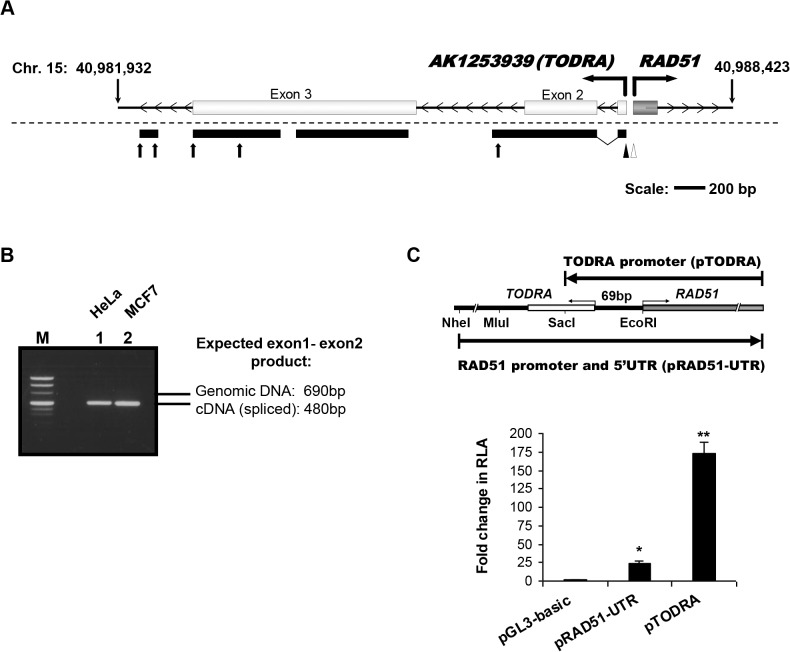
Fig 1. Transcriptional analysis of the RAD51/TODRA region.
A. TODRA transcript: Top: Schematic representation of the predicted TODRA (AK125393) gene, as described in the UCSC genome browser. Light grey shaded rectangles depict TODRA exons, the dark grey rectangle depicts RAD51 exon 1, transcribed in the opposite direction. Bottom: Results of TODRA transcript analysis. 5’RACE using capped HeLa mRNA, identified one transcription start site (full arrowhead, +1 corresponds to chr. 15: 40987374, hg19), and 3’RACE identified several possible transcription termini (arrows). The most 5’ end of RAD51 identified using 5’RACE is also shown (empty arrowhead, +1 corresponds to chr. 15: 40987303, hg19). Black bars beneath the diagram indicate confirmed regions of unidirectional transcription determined using strand specific primers for reverse transcription from both HeLa and MCF7 cells. B. Splicing of TODRA exons 1 and 2 is demonstrated in the representative gel. Lane M: pUC Mix Marker, (Fermentas), Lanes 1&2: TODRA strand specific RT-PCR products (F primer located in exon 1, R primer in exon 2). Expected size of product in genomic DNA: 696bp, Expected size of spliced transcript: 480bp, as observed in lanes 1 (cDNA prepared from HeLa cells) and 2 (cDNA prepared from MCF7 cells). C. The RAD51/TODRA region supports transcription in both directions. Top: Schematic representation of the RAD51 and TODRA promoter regions and the fragments cloned into luciferase promoter constructs. Bottom: TODRA putative promoter activity. MCF7 cells were co-transfected with the promoter-less pGL3-basic, pRAD51-UTR or pTODRA and pRL-TK (to normalize for transfection efficiency). Results are shown as fold increase in RLA (relative luciferase activity), compared to pGL3-basic. Values are means ± SE of 4–5 independent transfections performed in duplicates. * p< 0.002, ** p< 0.0001.

