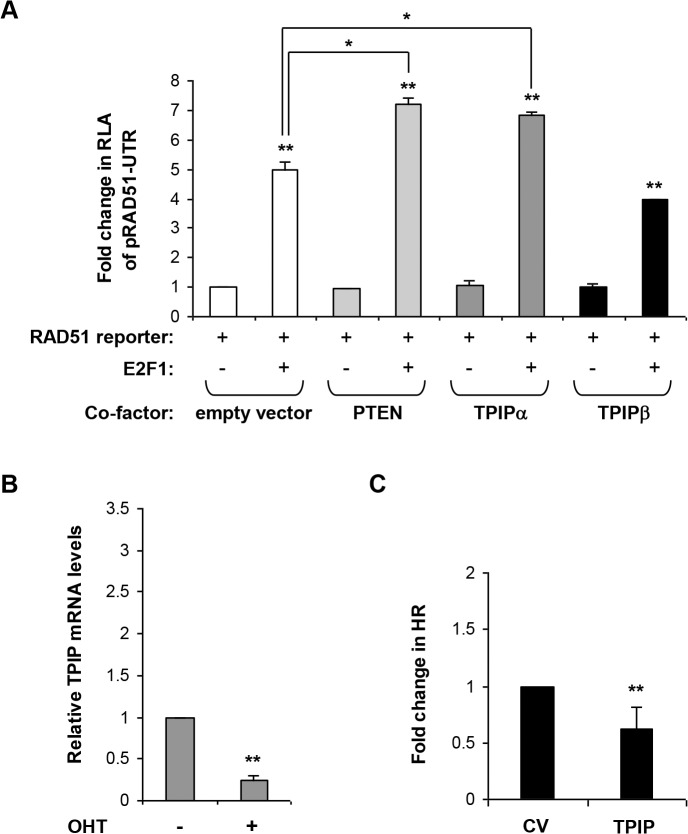
Fig 5. TPIP regulates RAD51 expression and activity.
A. TPIP co-activates E2F1 induction of RAD51. pRAD51-UTR with an E2F1 expression vector or an empty vector were co-transfected into serum starved MCF7 cells together with either PTEN, TPIPα, TPIPβ or an empty pEGFP-C2 based expression vector and pRL-TK (to normalize for transfection efficiency). Results are depicted as fold change in RLA compared to pRAD51-UTR alone (left bar). Values are means ± SE of 3 independent transfections performed in duplicates. ** p< 0.0001. Additional comparisons are indicated above the bars. * p = 0.002. B. E2F1 induction and endogenous TPIP expression. Endogenous TPIP mRNA levels were determined using quantitative real-time RT-PCR normalized to GAPDH, with and without E2F1 induction in serum starved ER-E2F1 U2OS cells. E2F1 was induced by treatment with OHT for 4 hours. Values are means ± SE of 4 independent experiments. Real-time reactions were performed in duplicates. ** p< 0.00001. C. Overexpression of TPIP reduces HR. HRind cells were transfected with an mOrange2 control vector (CV) or TPIP expression vector (tagged with mOrange2) and induced with Dexamethasone for 48 hours. GFP expression was measured by FACS. Results are depicted as the fold change in observed HR (as indicated by the number of GFP-positive cells among the transfected population [mOrange2 positive cells]) compared to the control vector. Values are means ± SE of 3 independent experiments performed in triplicate. ** p<0.002.

