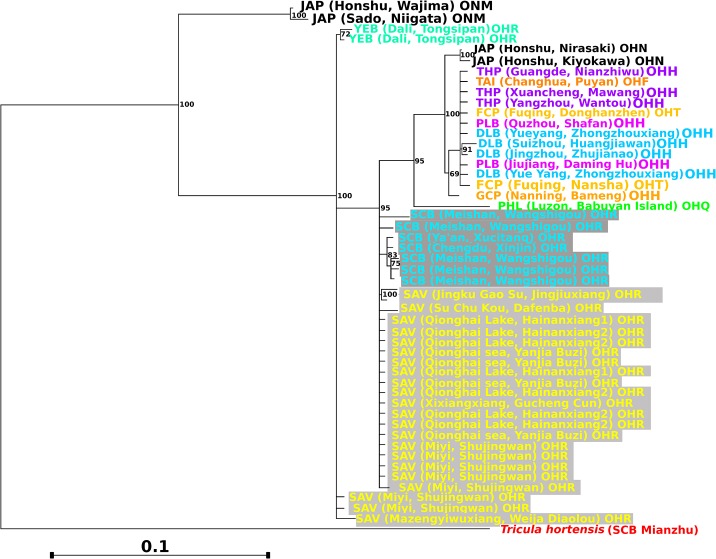
Fig 2. Phylogram representing the strict (100%) consensus tree between Maximum Parsimony (MP) and Maximum Likelihood (ML) phylogenies.
As estimated for the Oncomelania populations sampled at both loci, cox1 and rrnL, with clade support values averaged from 100000 bootstrap replicates (ML) and 5000 jackknife iterations (MP). The colours assigned to the taxon names correspond to those of the biogeographical areas mapped in Fig 1. The light and dark grey shading denotes the western mountain clades. The outgroup is in red.

