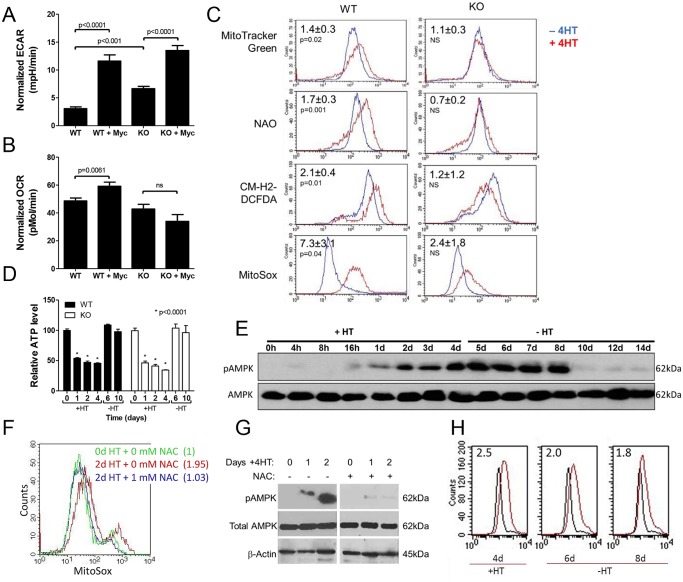
Fig 1. Energy-generating pathway responses to MycER activation.
(A) Baseline glycolysis measurements normalized to cell number at conclusion of the experiment. WT and KO MEFs were either untreated or exposed to 4HT for 7 days to activate MycER (+Myc). Glycolysis was quantified by measuring extracellular acidification rates (ECAR). Bars represent the mean of quadruplicate measurements ± 1 standard error of the mean (SEM). (B) Baseline Oxphos measurements. Oxygen consumption rates (OCR) were simultaneously quantified on the same samples described in A. See S2 Fig for additional details regarding the glycolytic and Oxphos responses of these cells. (C) Changes in mitochondrial mass and ROS production. Untreated or 4HT-treated (7 days) WT and KO cells were stained with MitoTracker Green or NAO to independently assess mitochondrial mass. In parallel experiments, cells were also stained with CM-H2-DCFDA to quantify total ROS production or with MitoSOX to specifically quantify the production of mitochondrial-derived superoxide. In all cases, typical flow diagrams are depicted. The numbers in the upper left portion of each panel indicate the mean ratios of fluorescence intensities between 4HT-treated and control, untreated cells from at least 4 independent experiments ± 1 SEM (D) ATP levels in response to MycER activation and inactivation. ATP levels were measured at baseline (S1B Fig), after the indicated periods of exposure to 4HT (+) and its subsequent removal (-). Each value shown depicts the mean of quadruplicate samples ± 1 SEM. Basal (day 0) ATP levels in untreated KO cells were routinely found to be 30–40% lower than those of their WT counterparts (S1B Fig) but are normalized here to 100% in both cell types for easier comparison. After taking the day 0 differences into account, KO MEFs also showed significantly lower ATP levels on days +1–4 compared to their WT counterparts (P < 0.02) (S1B Fig). (E) AMPK response to MycER activation/inactivation in WT MEFs. WT cells were exposed to 4HT for the indicated times. On day 4, 4HT was removed (-4HT) and cells continued to be cultured in its absence for an additional 6 days. Total AMPK and pAMPK were assessed by immunoblotting at the time points shown. (F) MitoSox staining as described in Fig 1C after 2 days of 4HT treatment. In the concurrent presence of 1 mM NAC, no significant change in ROS was observed. (G) AMPK activation is suppressed by NAC. WT cells were exposed to 4HT in the absence or presence of 1 mM NAC. Total and phospho-AMPK were assessed by immuno-blotting as described for panel E. (H) Persistence of ROS following MycER inactivation. WT cells were exposed to 4HT for 4 days at which point ROS were quantified using MitoSox as described in (C). 4HT was then removed with ROS levels again being determined 2 and 4 days later (days 6 and 8). Numbers in upper left corner indicate the ratio of mean fluorescence intensity of 4HT-treated (red curves) to non-4HT-treated MEFs (black curves).

