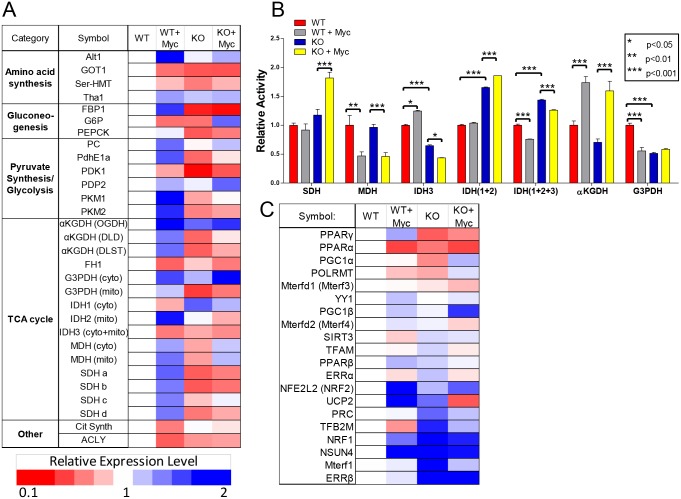
Fig 3. Transcriptional and enzymatic differences between WT and KO MEFs.
(A) Transcriptional profiling. Real-time qRT-PCR was performed in triplicate for each of the indicated transcripts. The levels of each transcript determined in WT cells were arbitrarily set to 1 as indicated by the white boxes. See S4 Fig for the actual numerical values and p values for individual determinations. (B) Functional assays for oxidoreductases. Each bar represents the mean of biological triplicate determinations ± 1 SEM performed on purified mitochondrial lysates. Note that the results for SDH are the same as those presented in Fig 2C. (C) qRT-PCR profiling of transcripts involved in the regulation of mitochondrial DNA replication and maintenance, transcription and function. Analyses were performed as described for (A). See S5 Fig for the actual numerical differences and p values for individual determinations.

