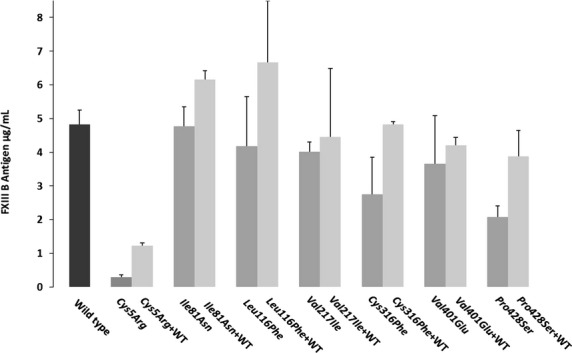
Figure 1.

Transient homozygous/heterozygous expression of the reported missense mutations. This image represents comparative bar graph representations for the mutant and wild-type FXIIIB expression antigen values, homozygous as well as heterozygous. The leftmost black bar represents the wild type. Amongst the other bars, the dark gray represent homozygous mutant expression while the light represents the heterozygous expression (cotransfection with wild type). All values have already been normalized for transfection efficiency with beta galactosidase levels. The error bars represent the standard deviation.
