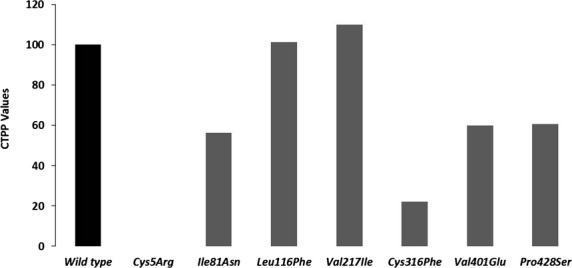
Figure 3.

CTPP values representing FXIIIB-binding ability. This image is a comparative bar graph description of the wild type versus mutant FXIIIB subunit CTPP (comparative tetramerization potential percentage) values. The calculations for CTTP have been explained in the methods section. Since the CTTP values are a comparative representation when the wild type is considered to be 100%, therefore no error bars are shown for this figure.
