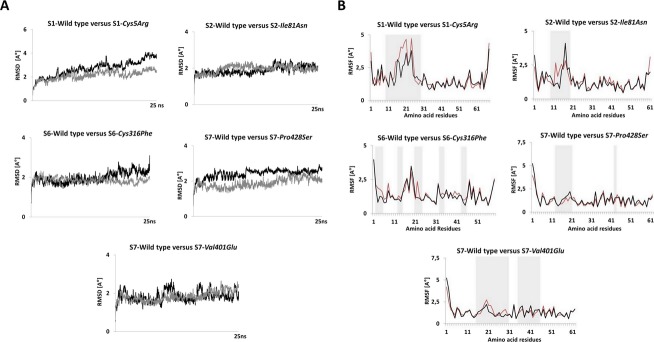
Figure 5.

Simulation RMSD and RMSF comparisons for wild-type and mutated sushi domains. (A) Changes in RMSD during the 25 ns simulation for the mutated and wild-type sushi domains. Only the high impact mutations Cys5Arg, Cys316Phe, Pro428Ser that undergo significant changes in RMSD during simulation and one Ile81Asn mutation with no observable difference in RMSD are illustrated here. The dark black patterns represent wild-type RMSDs while the gray patterns represent the mutant RMSDs in each graph. (B) Observed RMSF per residue during simulation for the mutated and wild-type sushi domains. Only the high impact mutations Cys5Arg, Cys316Phe, Pro428Ser and two other mutations Ile81Asn and Val401Glu are shown here. The regions showing noticeable differences in RMSFs are shaded in gray. The red patterns represent the wild-type RMSFs while the black pattern represents the mutated RMSFs in each graph. The RMSD and RMSF calculation for the simulation trajectories were done on YASARA version 13.9.8. RMSD, root mean square deviation; RMSF, root mean square fluctuation.
