
Figure 1.
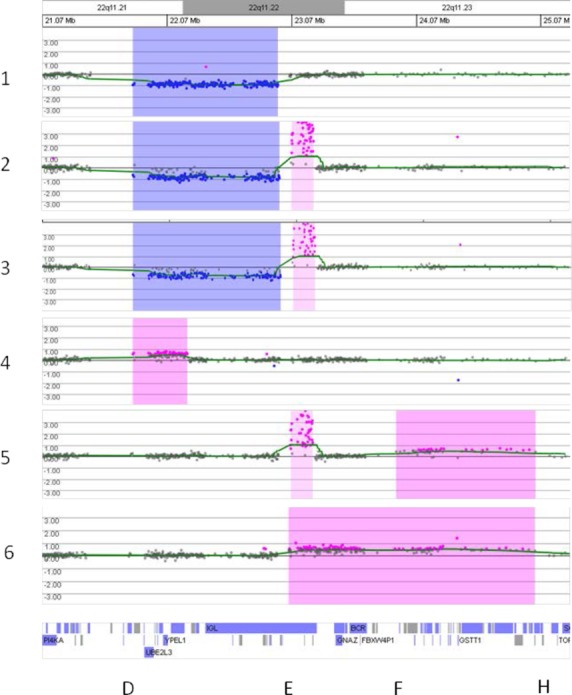
Array comparative genomic hybridization analysis plots of log2(patient/reference signals) on the vertical scale versus position of the oligonucleotide clone on chromosome 22 in the region of q11.21–q11.23 on the horizontal scale. Analysis of patients 1–6 is shown from top to bottom. Blue shading indicates a loss in the patient compared to the control while pink indicates a gain. The UCSC Genome Browser position of genes is below the sixth plot and the letters D, E, F, and H at the bottom represent the approximate locations of the low copy repeat (LCR) sequences LCR22 D–H. Patients 1, 2, and 3 have deletions generated by rearrangements involving LCRs D and E, while patients 5 and 6 have duplications flanked by LCR22 H on the distal end and LCR22s E and F, respectively, on the proximal end. Patient 4 has an atypical duplication generated using LCR22 D on the proximal end but the distal breakpoint is not at a LCR. The areas shaded with lighter pink for patients 2, 3, and 5 represent benign variant gains within the IGL gene.