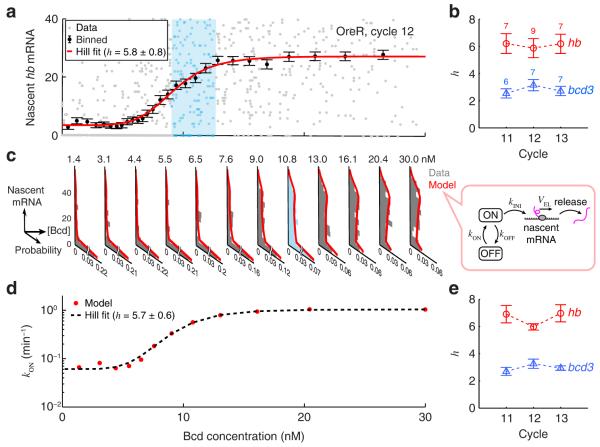
Figure 2. The regulatory relation between Bcd concentration and hb transcription.
(a) The number of nascent mRNAs at individual hb loci plotted against nuclear Bcd concentration (single embryo, >600 nuclei, 0.25-0.7 EL). The single-locus data was binned along the Bcd axis (mean ± S.E.M.) and fitted to a Hill function. One window of Bcd concentration (corresponding to one histogram in Panel c) is highlighted in cyan.
(b) The Hill coefficient of the gene regulation function. Error bars represent S.E.M. from the indicated number of embryos.
(c) Nascent hb mRNA histograms at different Bcd concentration windows, covering the entire data set of Panel a. The histogram corresponding to the highlighted window in Panel a is marked in cyan. Each histogram was fitted to a two-state model of hb transcription (right).
(d) The rate of stochastic gene activation, kON, estimated using the procedure above, is plotted against nuclear Bcd concentration, and fitted to a Hill function.
(f) The Hill coefficient of kON activation, calculated for the same embryos as in Panel b. Error bars represent S.E.M.

