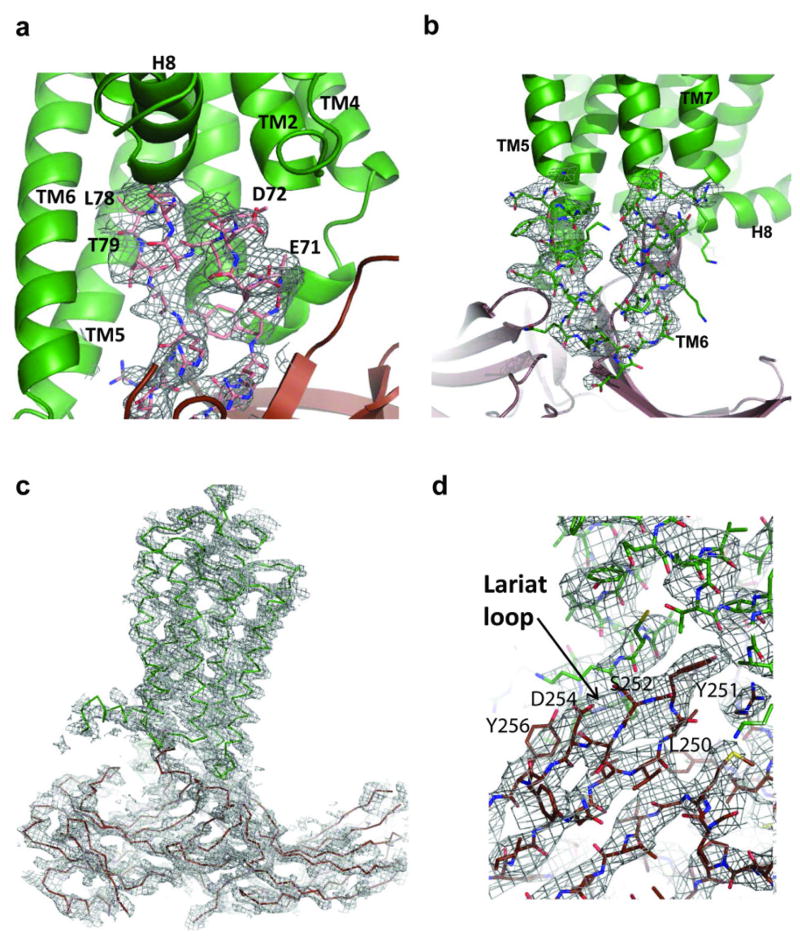
Extended Data Fig. 3. Electron density map for the overall complex and the key interfaces based on the XFEL data.
a, A 2Fo–Fc electron density map contoured at 1 σ of the arrestin finger loop, which forms the key interface with TM7 and Helix 8.
b, A 2Fo-Fc electron density map contoured at 1 σ of the loop between TM5 and TM6, which forms the key interface with the β-strand following the finger loop.
c, A 3000K simulated annealing omit map (2Fo-Fc electron density map contoured at 1 σ) calculated from the 3.8Å/3.8Å/ 3.3Å XFEL data supports the overall arrangement of the rhodopsin-arrestin complex. In all panels, the complex structure is shown with rhodopsin colored in green, arrestin in brown and T4L in yellow.
f, Stereo views of the lariat loop with a 2Fo-Fc composite omit map at 1 σ calculated from the 3.8Å/3.8Å/ 3.3Å truncated XFEL data. Key residues are labeled.

