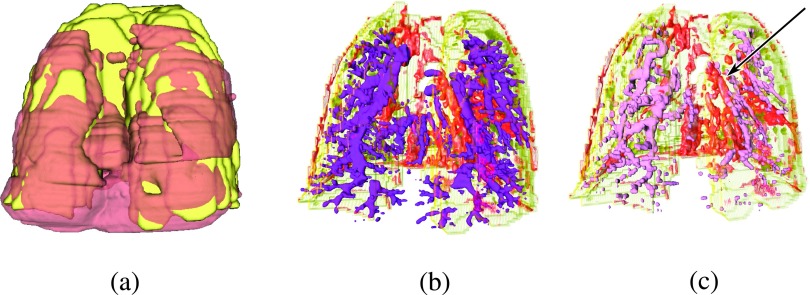
FIG. 7.
Visualization of the 3D histology volume, (brown), and in vivo MRI volume, (yellow), alignment; (a) overlay of and ; (b) overlay of airways from (dark purple) onto blood vessels from (red). (c) Overlay of blood vessels from (red) and blood vessels from (pink). Arrow points to area of visually assessed close overlap.

