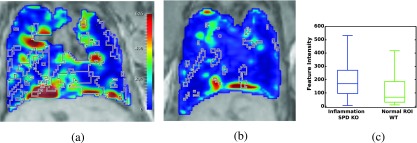
FIG. 8.

Preliminary evaluation of the framework in characterizing imaging signatures of inflammation. The most discriminative feature (Gabor) is shown using the same colormap in (a) Sftpd−/− lung with mapped inflammation (outlined with the black and white line) from 3D histology reconstruction; (b) WT lung with volume of interest (outlined with the black and white line); (c) feature distributions show modest separation between the computer extracted features derived from the inflamed and noninflamed regions.
