Fig. 3.
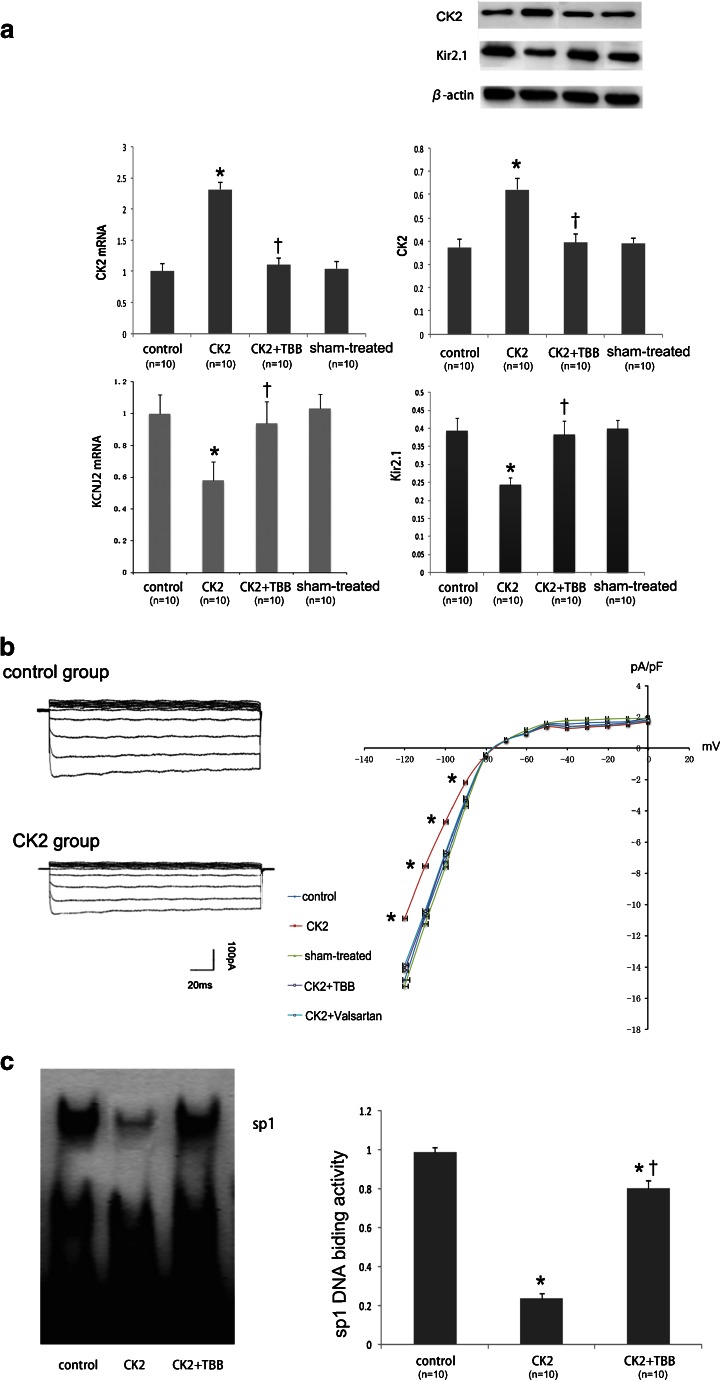
The regulation of Kir2.1 expression by CK2. a A qPCR analysis and a Western blot analysis demonstrating the CK2 level after transfection (n = 10) and inhibition by TBB (n = 10) and the effects of CK2 (n = 10) and its inhibition (TBB; n = 10) on Kir2.1 protein expression in H9c2 rat ventricular cells. *P < 0.05 vs. control; † P < 0.05 vs. CK2 alone. b IK1 density in cultured neonatal rat ventricular cardiomyocytes. IK1 was elicited by 200-ms pulses at the indicated voltages. *P < 0.05 vs. control; n = 10/group. c Autoradiograms and the EMSA quantification of Sp1 DNA-binding activity in H9c2 rat ventricular cells. The data are the fold values of DNA-binding activity in the CK2 + TBB group compared with the CK2 group. *P < 0.05 vs. control; † P < 0.05 vs. CK2 alone; n = 10/group. Values are means ± SDs

