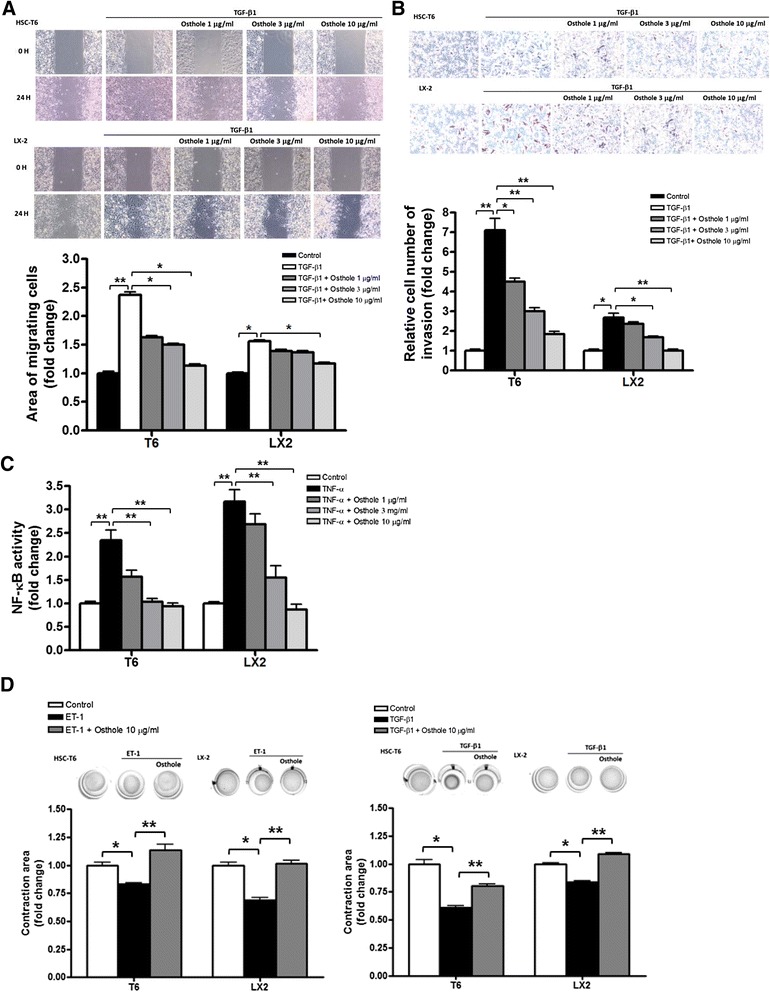
Fig. 4.

Osthole downregulated HSC activation. a Wound healing assay in HSCs (both HSC-T6 and LX2 cells). Cells were treated by osthole (1, 3 and 10 μg/ml) after creating wounds. Graphs represent cell migration assessed at 0 h and 24 h after exposure to TGF-β1 (1 ng/ml), and quantification of wound closure was shown below, n = 3. b Cell invasion assay in HSCs. Cells were treated by osthole (1, 3 and 10 μg/ml) and then stimulated with TGF-β1 for 24 h. Graphs displaying the bottom side of the filter inserts with cells that migrated through the filter pores. Graphs of quantification graphs represent the analysis of the cell count. c NF-κB activity of HSCs which were transfected with CMV-βgal and the reporter plasmid containing NF-κB responsive region for 24 h. Cells were pre-treated with osthole (1, 3 and 10 μg/ml) for 1 h, followed by 6 h TNF-α (1 ng/ml) stimulation, then NF-κB activity was detected by luminescence. CMV-βgal was used as internal control to normalize the transfection efficiency. n = 3. d Osthole-inhibited ET-1- or TGF-β1-induced HSC contraction. Cultured HSCs were serum-starved 24 h prior to seeding onto collagen lattices. Cells were pre-treated with control or osthole in 10 μg/ml and subsequently treated with ET-1 (1 nmol/l) or TGF-β1(1 ng/ml) after 30 min. Graphs of quantification graphs represent the analysis of the area of collagen circle. n = 3. *p < 0.05; **p < 0.01, compared with other groups
