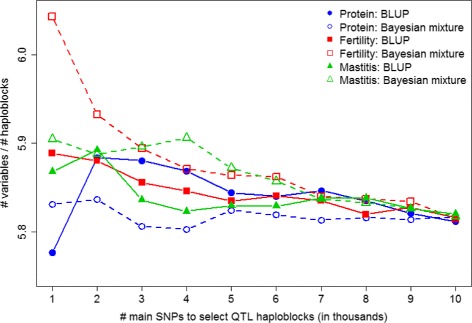
Fig. 6.

Ratio between total number of haploblock variables used in the prediction models and total number of haploblocks containing the main SNP effects. The values on the x-axis are the number of main SNPs used to select QTL-haploblocks to perform genomic prediction, and the y-axis indicates the ratio (haploblock variables)/haploblocks
