Fig. 2.

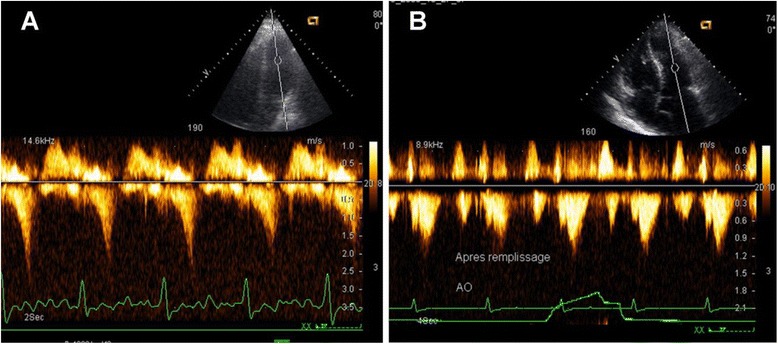
Left intraventricular obstruction. a Pulsed-wave Doppler curve showing the characteristic late peaking saber-shape indicating a LV outflow obstruction (IVG). b After fluid replacement, the flow profile returns to normal symmetrical shape

Left intraventricular obstruction. a Pulsed-wave Doppler curve showing the characteristic late peaking saber-shape indicating a LV outflow obstruction (IVG). b After fluid replacement, the flow profile returns to normal symmetrical shape