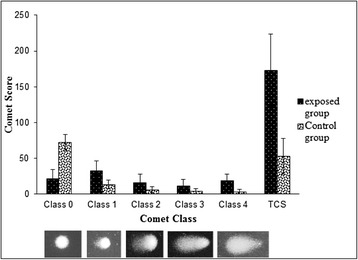
Fig. 1.

DNA damage assessed using the comet assay. Mean comet score and comet classes in control and exposed groups. The cells were assessed visually and received class 0 (undamaged) to 4 (maximally damaged), according to the size and shape of the tail. Score were obtained using the mean score of three independent, blind evaluators
