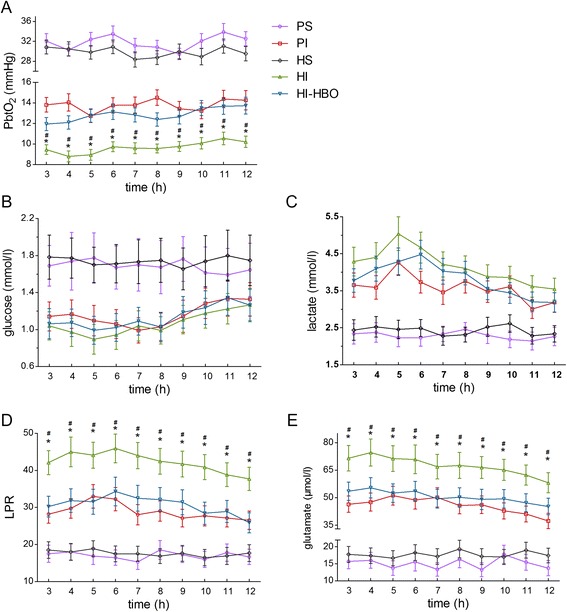
Fig. 2.

Changes in cerebral oxygenation and metabolism from three to 12 h post-ICH. a At each time point, PbtO2 in HI animals was significantly lower than in PI animals, and it was significantly elevated in HI-HBO animals. b Although the level of glucose in HI animals was lower than in the PI or HI-HBO animals at most of the time points, there was no significant difference between the three groups. c Likewise, lactate in HI animals was higher than in the PI or HI-HBO animals at all time points, but no significant difference existed between them. d LPR in HI animals was significantly higher than in the PI and HI-HBO animals at each time point. e Likewise, glutamate in HI animals was significantly higher than in the PI and HI-HBO animals at each time point. # P <0.05, compared with PI; * P <0.05, compared with HI-HBO
