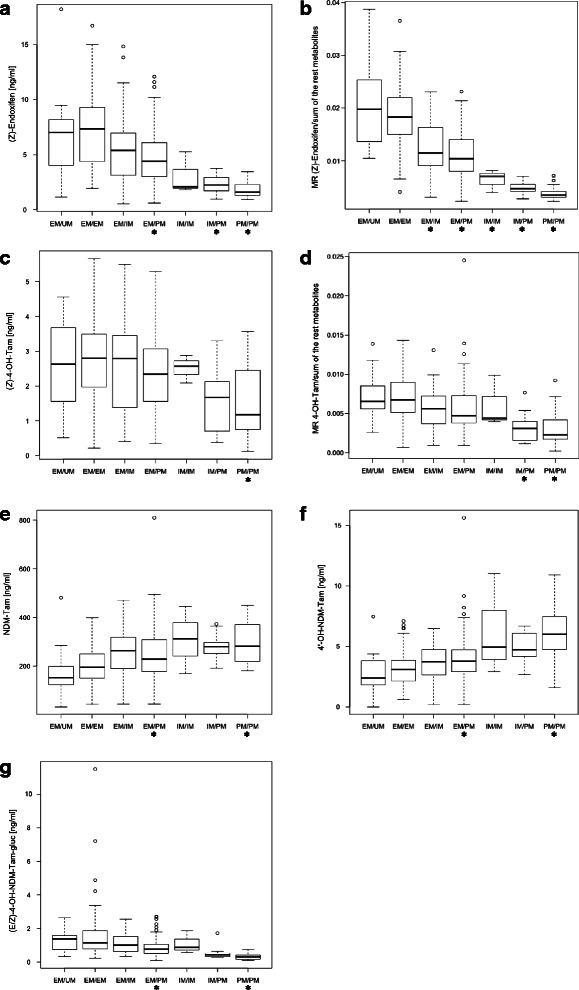
Fig. 1.

Significant association of the CYP2D6 genotype with plasma concentration and molecular ratio of tamoxifen metabolites. a (Z)-endoxifen, b The MR of (Z)-endoxifen/sum of the remaining measured compounds, c (Z)-4-OH-tamoxifen, d MR of (Z)-4-OH-tamoxifen/sum of the remaining compounds, e N-desmethyl-tamoxifen, f 4′-OH-N-desmethyl-tamoxifen, g (E/Z)-4-OH-N-desmethyl-tamoxifen-β-D-glucuronide. The number of patients (N) was as follow: EM/UM (18), EM/EM (87), EM/IM (43), EM/PM (97), IM/IM (3), IM/PM (11), PM/PM (20). The horizontal line indicates the median plasma concentration, the box covers 25th-75th percentiles and the maximum length of each whisker is 1.5× the interquartile range; dots outside the whiskers are outliers. Linear model (ordinary least squares) was fitted independently in six functional groups with EM/EM as a reference to examine whether there was an association between the measured metabolite concentration and CYP2D6 phenotype. Student’s t statistics was used to test if fitted coefficients were different than 0. The Bonferroni corrected p-value of less than 6.9 × 10⁻⁴ was considered significant. Significant associations are marked with asterisk (*)
