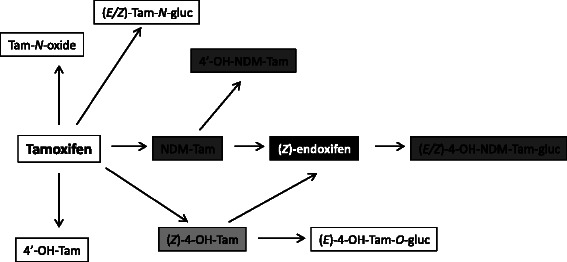
Fig. 4.

The (Z)-endoxifen-directed metabolism of tamoxifen according to the association of its metabolites concentration with CYP2D6 genotype. The intensity of gray shading corresponds with the number of CYP2D6 genotype predicted functional groups with a significant (p < 6.9 × 10⁻⁴) association with metabolite plasma concentration. White indicates no association and black indicates association with three genotypes, as indicated by linear modeling (see Fig. 1)
