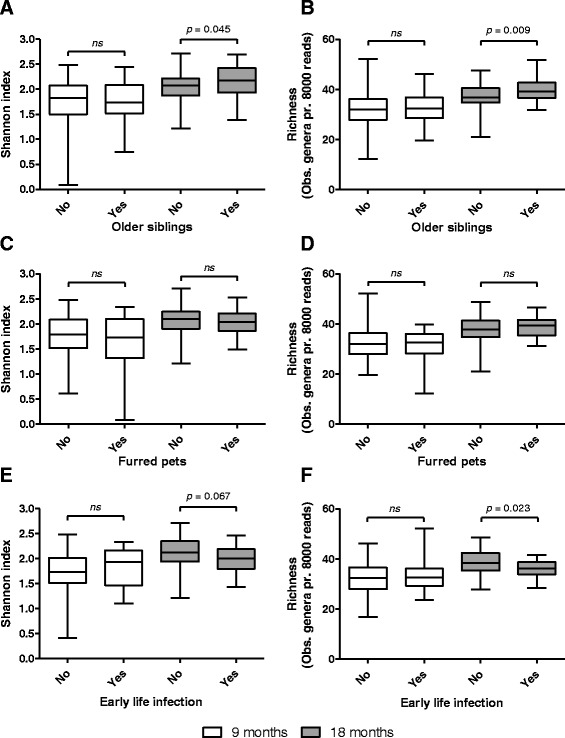
Fig. 1.

Boxplots comparing bacterial diversity and richness at 9 months (white color) and 18 months (grey color) between individuals with or without older siblings (a, b), furred pets (c, d) and early life infections (e, f). Boxes show 25th to 75th percentiles and whiskers indicate minimum to maximum values. Statistical significance was evaluated by Mann Whitney test, using p < 0.05 as measure of significance. ns = not significant, however p-values below 0.1 are shown
