
Fig. 2.
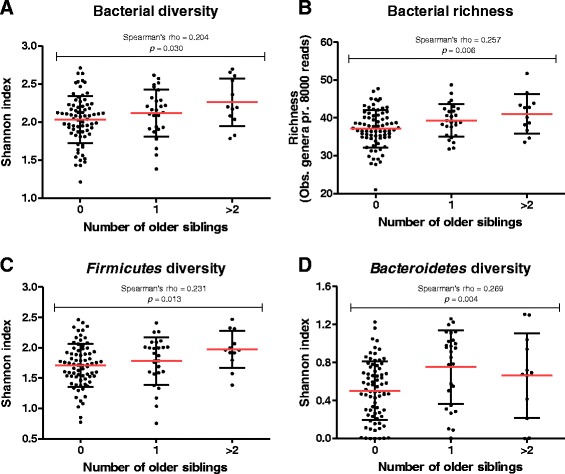
Scatter plots illustrating the bacterial diversity (a), richness (b) and phyla diversities of Firmicutes (c) and Bacteroidetes (d) in infants at 18 months of age divided into groups according to the number of older siblings in the household. Red lines indicate mean ± standard deviation. Spearman’s correlations coefficient rho and p-value (p < 0.05 as a measure of significance) are shown