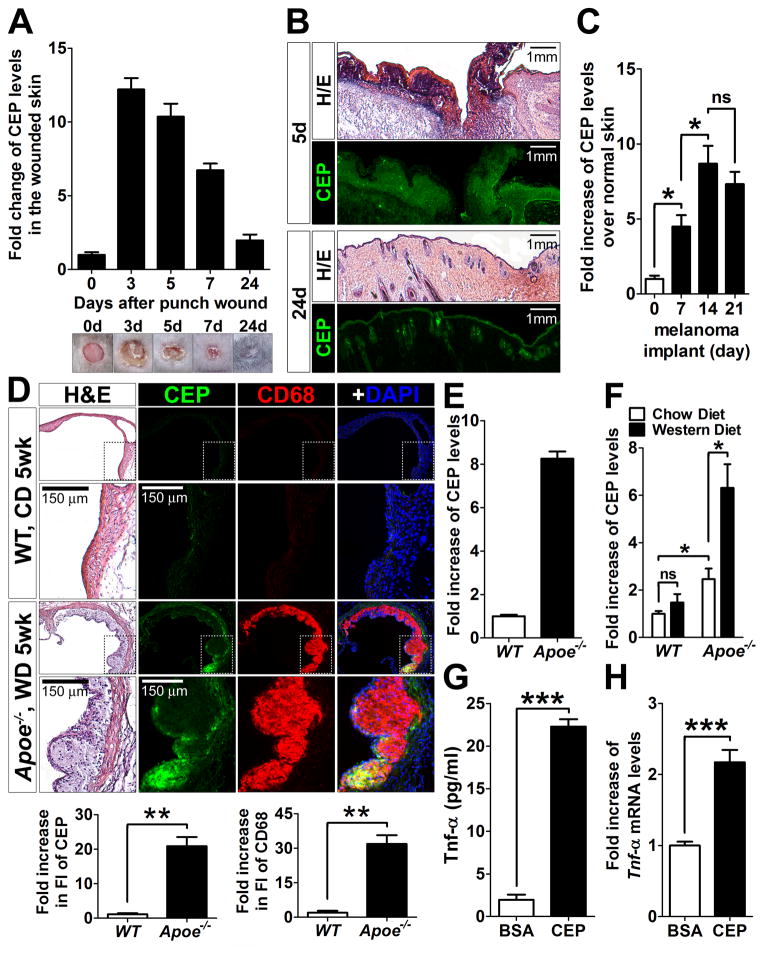
Figure 1. Regulation of CEP levels in vivo.
A. The presence of CEP-containing modifications in vivo during wound healing (n=5, top). The wounded skins were collected at the indicated times, homogenized, and then each supernatant was used for ELISA. CEP concentration was normalized by total protein concentration. Bottom: Representative images of wounds on the mouse back skins at the times indicated (n=5) are shown. B. Hematoxylin-eosin and CEP immunofluorescence staining of the wounded skins at day 5 (5d) and 24 (24d). Note that CEP is stained on the scabs, granulation tissues, and hypertrophic epidermal wound edges at day 5, whereas CEP is slightly stained in the epidermis and hair follicles at day 24. C. CEP accumulation in implanted B16-F10 murine melanomas was measured by ELISA. Melanomas were collected at day 7, 14, and 21 after subcutaneous injections of B16-F10 murine melanoma cells (7.0 × 10⁵ cells per injection) into mice (n=4). D. Hematoxylin-eosin and fluorescence staining for CEP, CD68 (macrophages) and DAPI (nuclei) of the aorta of Apoe−/− mice (fed with western diet for 5 weeks) and age- and gender-matched WT control mice (fed with chow diet). Note that CEP was positively stained only in atherosclerotic lesions (n=3). Bottom: quantification of CEP and CD68 immunofluorescence of WT and Apoe−/− mice. Fold increase over WT control is shown. E. Plasma levels of CEP from the same Apoe−/− and WT mice (D), measured by ELISA (n=3). Fold increase over WT control is shown. The absolute concentration of CEP in Apoe−/− mice was 70–100× 10−12 M based on CEP standard, see Methods). F. Plasma levels of CEP from Apoe−/− and WT mice, which were fed with a chow or western diet for 16 weeks, were measured by ELISA. Fold increase over WT control on chow diet is shown. G. Upregulation of TNF-α, measured by ELISA, in thioglycolate-elicited mouse peritoneal macrophages upon treatment with 10 μM of CEP-BSA for 4 hours. H. Upregulation of Tnf-α gene, measured by qPCR, in R-MPMs upon treatment with 10 μM of CEP-BSA for 4 hours. Fold increase over BSA-treated cells is shown.

