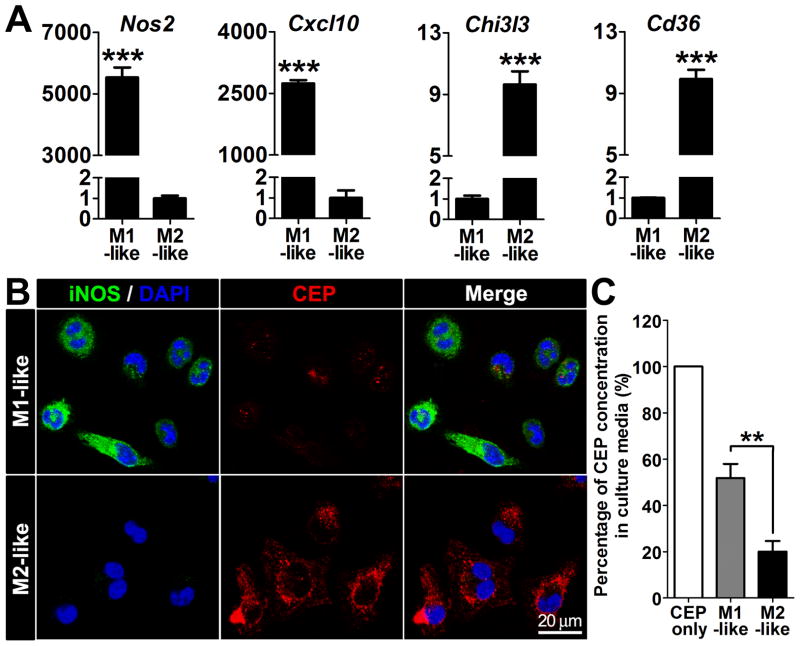
Figure 3. CEP binding and scavenging by M1- or M2-like macrophages.
A. Expression of M1 and M2 marker genes in polarized macrophages. Quantitative real-time RT-PCR analysis of representative M1 marker genes (Nos2 and Cxcl10) and M2 marker gene (Chi3l3 and Cd36) normalized by 18s, from R-MPMs is shown. B. Immunofluorescence of CEP, iNOS (M1 marker) and DAPI on M1-like and M2-like macrophages treated by 500 nM of CEP-BSA for 20 min. C. CEP levels that remained in the culture media. After 500 nM CEP-BSA was treated to the R-MPMs at 37 °C for 24 hours, the supernatants were collected. CEP levels were measured by ELISA and normalized to the CEP only-containing culture media without macrophages (this was assigned a value of 100%).

