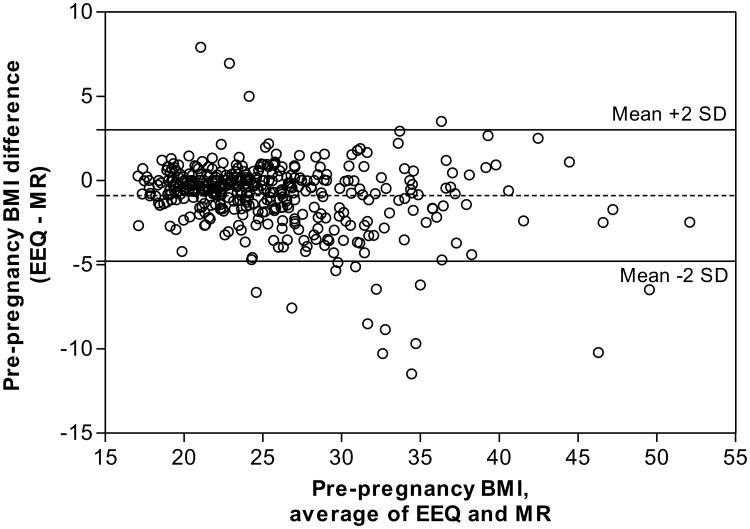
Figure 2.
Bland-Altman plot comparing pre-pregnancy BMI from the EEQ and medical records (MRs). Pre-pregnancy BMI was calculated using height and pre-pregnancy weight reported in the EEQ or recorded in the medical records. The difference between pre-pregnancy BMI in the EEQ and BMI in the MR is plotted against the average for these two data sources with 95% limits of agreement. The dashed horizontal line denotes mean bias. The solid horizontal lines above and below the dashed line indicate the upper and lower limits of agreement. The mean bias detected was -0.87, and only 3.9% of the BMI values were outside of the 95% limits of agreement (-4.81 to 3.07).

