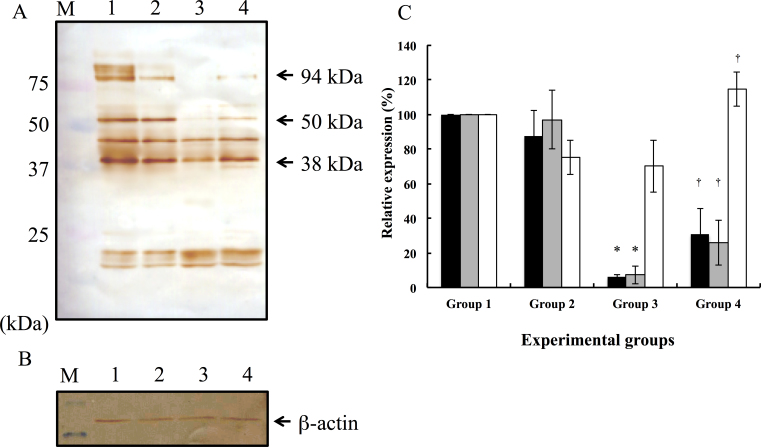
Figure 2.
Degradation of filensin. Western blot analysis with an anti-filensin antibody. A: The 94 kDa form of filensin is processed into the 50 kDa and 38 kDa forms in vivo (arrow). B: Western blot analysis with anti-β-actin antibody as an internal control. Lane 1: control group (G1). Lane 2: hesperetin-treated group (G2). Lane 3: selenite-treated group (G3). Lane 4: selenite and hesperetin-treated group (G4). M shows the molecular weight standards. C: The respective bar diagrams show the band intensity (densitometric value) of the 94 kDa (black bar), 50 kDa (gray bar), and 38 kDa (white bar) forms of filensin levels relative to the levels in the control G1 group. All bar diagrams are expressed as the mean ± SD, and statistical analysis was determined using the unpaired Student t-test. *p<0.05 versus control (G1 group) and †p<0.05 versus rats with selenite-induced cataracts without hesperetin treatment (G3 group; n = 9 in each group).

