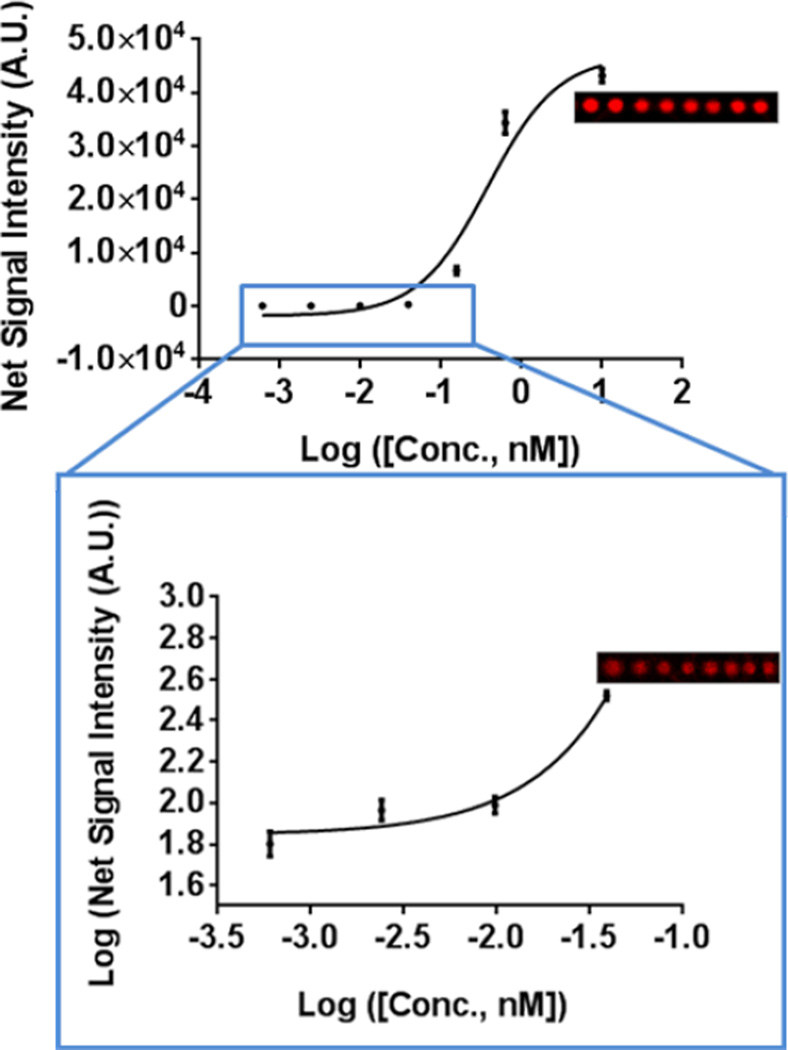
Figure 8.
Dose response curve depicting fluorescent spot intensities of miR-21 assayed on the PC over a concentration range of 1.0nM – 0.60pM. All seven assayed concentrations were detectable over the background fluorescence signal with the four lowest assayed concentrations highlighted in the blue rectangle and magnified. The local background is indicated as the red line. Representative fluorescence images of microspots at assayed miR-21 concentrations of 2.5nM and 39pM are presented alongside each graph. Data represents mean ± S.D. values of sixteen replicate spots.

