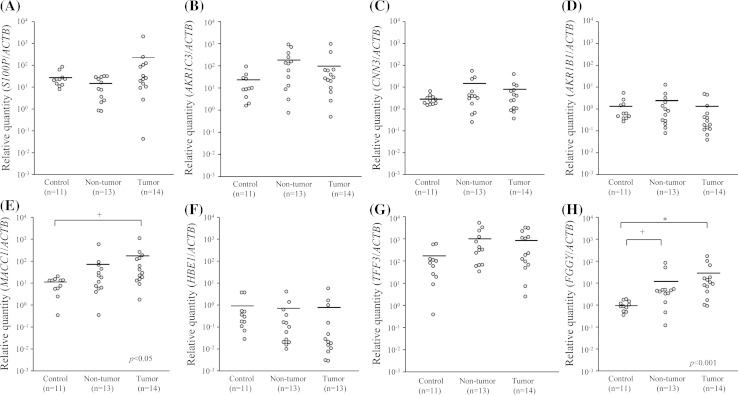
Fig. 1.
Relative mRNA expression of S100P, AKR1C3, CNN3, AKR1B1, MACC1, HBE1, TFF3, and FGGY in tissues from colorectal cancer (CRC) patients determined by real-time quantitative RT-PCR. Dots showed mRNA levels in 13 non-tumor tissues and 14 tumor tissues from CRC patients compared with 11 inflammatory tissues from ulcerative colitis patients as controls. Bars showed means. a The relative quantity values (Mean ± SD) of S100P are 28.68 ± 24.20, 14.43 ± 12.90, and 199.51 ± 549.78 (control, non-tumor, and tumor). b Those of AKR1C3 are 21.09 ± 26.93, 214.87 ± 291.55, and 124.88 ± 266.74. c Those of CNN3 are 2.86 ± 1.53, 10.44 ± 16.20, and 6.93 ± 10.30. d Those of AKR1B1 are 1.32 ± 1.57, 2.15 ± 3.55, and 0.96 ± 1.63. e Those of MACC1 are 10.04 ± 6.12, 69.13 ± 158.41, and 145.37 ± 289.74. f Those of HBE are 0.89 ± 1.43, 0.55 ± 1.15, and 0.67 ± 1.61. g Those of TFF3 are 154.79 ± 216.76, 1,116.46 ± 1,610.72, and 908.91 ± 1,158.59. h Those of FGGY are 1.02 ± 0.50, 13.30 ± 25.12, and 30.65 ± 49.14, respectively. The p values are based on Kruskal–Wallis test. +p<0.05 and *p < 0.01 are based on Mann–Whitney U test with a Bonferroni correction

