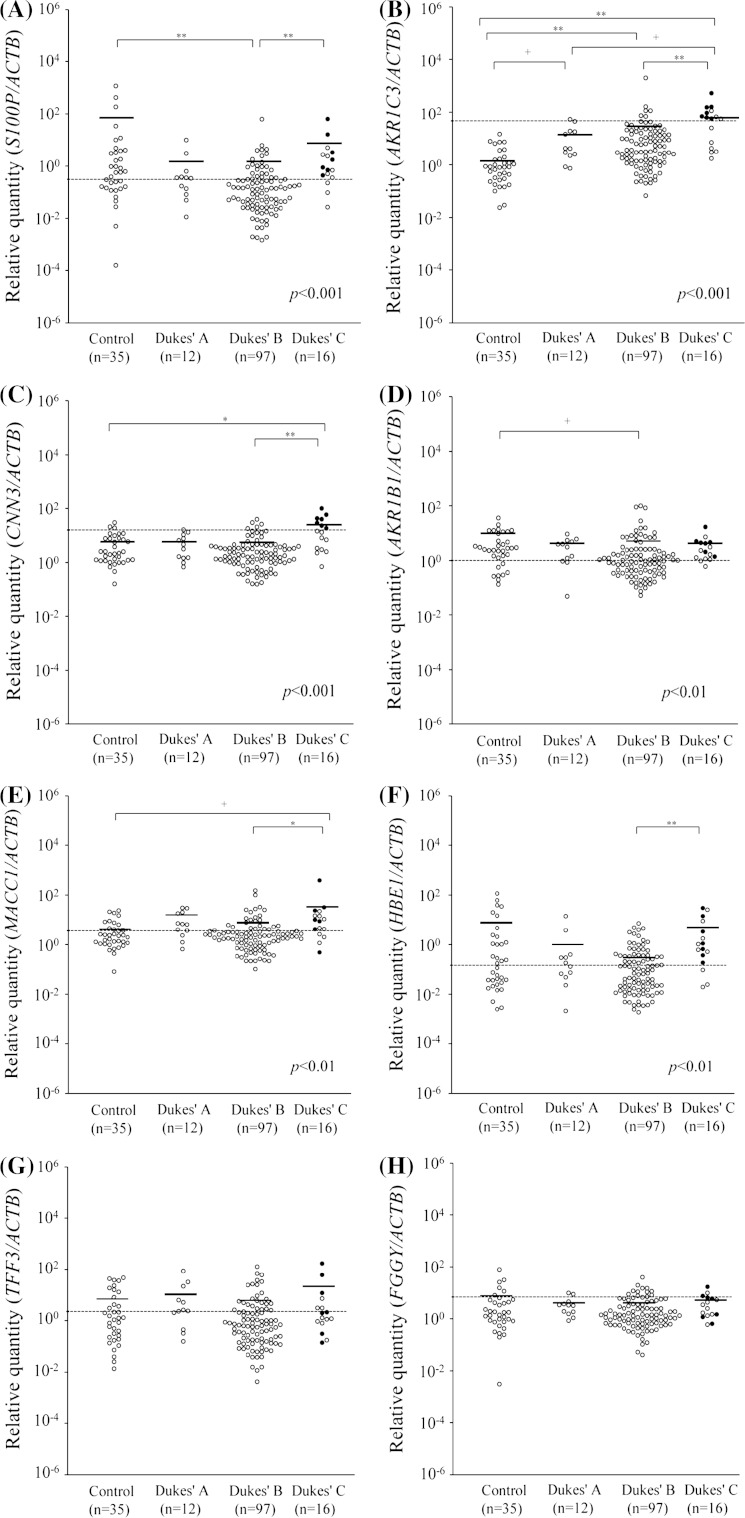
Fig. 2.
Relative mRNA expression of S100P, AKR1C3, CNN3, AKR1B1, MACC1, HBE1, TFF3, and FGGY in lymph nodes (LNs) from colorectal cancer (CRC) patients categorized by Duke’s classification. Dots showed mRNA levels in 125 LNs from CRC patients with Dukes’ stage A, B, and C, compared with 35 LNs from ulcerative colitis patients as controls. Black dots indicate LNs with tumor cells, and gray dots indicate LNs without tumor cells identified by hematoxylin–eosin staining. Broken lines show cutoff values of eight genes in Table 4. Bars showed means. a The relative quantity values (Mean ± SD) of S100P are 53.17 ± 208.51, 1.30 ± 2.86, 1.10 ± 6.44, and 6.24 ± 16.00 (control, Dukes’ A, Dukes’ B, and Dukes’ C). b Those of AKR1C3 are 1.97 ± 3.14, 13.99 ± 17.82, 34.03 ± 201.50, and 87.72 ± 127.72. c Those of CNN3 are 5.46 ± 6.73, 5.73 ± 5.28, 4.06 ± 6.39, and 22.97 ± 26.78. d Those of AKR1B1 are 5.49 ± 7.29, 3.44 ± 2.72, 5.15 ± 15.99, and 3.64 ± 4.01. e Those of MACC1 are 4.53 ± 6.06, 10.87 ± 10.81, 6.43 ± 18.75, and 34.17 ± 95.53. f Those of HBE are 8.57 ± 22.92, 1.61 ± 4.06, 0.48 ± 1.14, and 5.52 ± 9.51. g Those of TFF3 are 7.75 ± 13.53, 13.54 ± 25.01, 5.48 ± 16.74, and 16.70 ± 43.65. h Those of FGGY are 6.45 ± 14.38, 3.67 ± 2.87, 3.20 ± 5.24, and 4.41 ± 4.33, respectively. The p values are based on Kruskal–Wallis test. +p<0.05, *p < 0.01 and **p < 0.001 are based on Mann–Whitney U test with a Bonferroni correction

