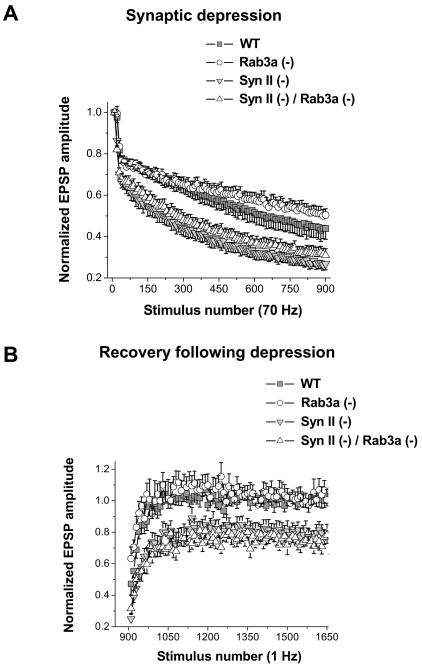
Fig. 2. Syn II(−) and Syn II (−) / Rab3a (−) DKO endplates have increased synaptic depression and incomplete recovery.
A. Normalized EPSPs during a 70 Hz train of stimuli. Rab3a (−) preparations demonstrate slightly decreased synaptic depression, while both Syn II (−) and Syn II (−) / Rab3a (−) DKO preparations demonstrate increased synaptic depression compared to WT. Each data point represents the average of 10 responses.
B. Recovery rate. EPSPs were recorded every second immediately following the high-frequency stimulation. WT and Rab3a (−) preparations demonstrate complete recovery following depression, while both Syn II (−) and Syn II (−) / Rab3a (−) DKO have impaired recovery. Each data point represents a single response. Data collected from 11 WT, 12 Rab3a (−), 13 Syn II (−), and 12 Syn II (−) / Rab3a (−) DKO endplates.

