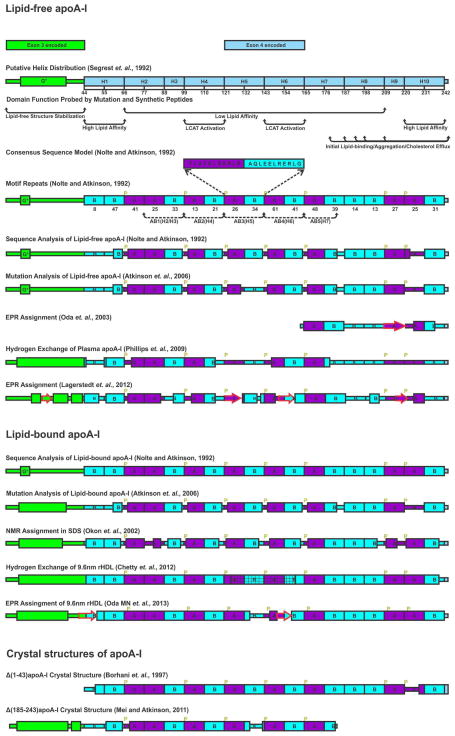
Figure 2.
Illustration of helix distribution of lipid-free, lipid-bound apoA-I derived from different methods and crystal structures of truncated apoA-I. Exon-3-encoded region (residues 1–43) is green. Exon-4-encoded region [44–243] is ice-blue. Consensus sequence peptide (CSP) A and B homology sequences are in purple and cyan, respectively. Prolines are labeled in yellow. Five AB repeats are labeled with black dotted lines with arrows. Helical structure is labeled with a rectangle while beta strand is labeled with a red arrow. Bimodal structure is labeled with a rectangle with mesh.

