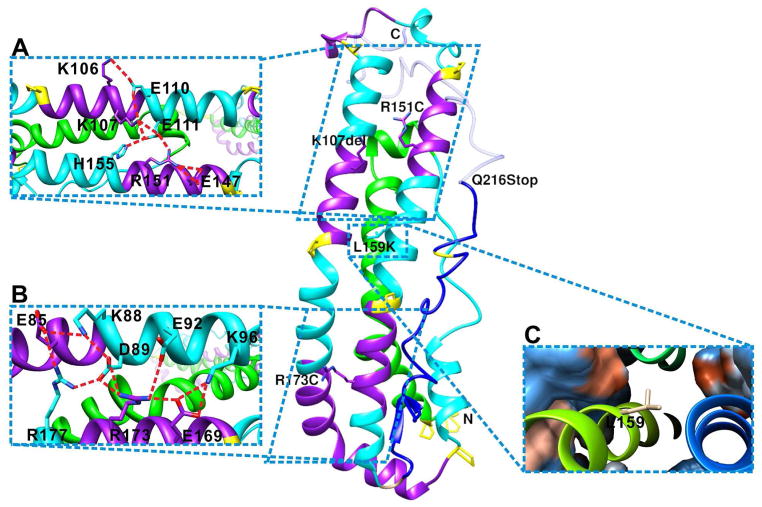
Figure 6.
Mapping the natural mutations on full-length apoA-I monomeric model. A, K107 and R151 are in the salt-bridge network that stabilize the N-terminal helix bundle. B, R173 is in the salt-bridge network that stabilized the N-terminal helix bundle. C, L159 is located in the hydrophobic center inside of the N-terminal helix bundle. Orange color shows hydrophobic surface, whereas blue shows hydrophilic surface.

