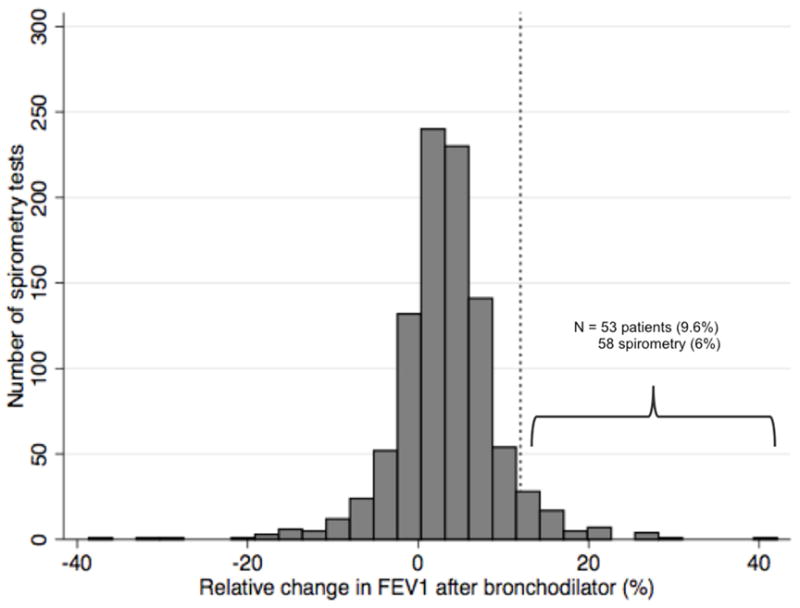
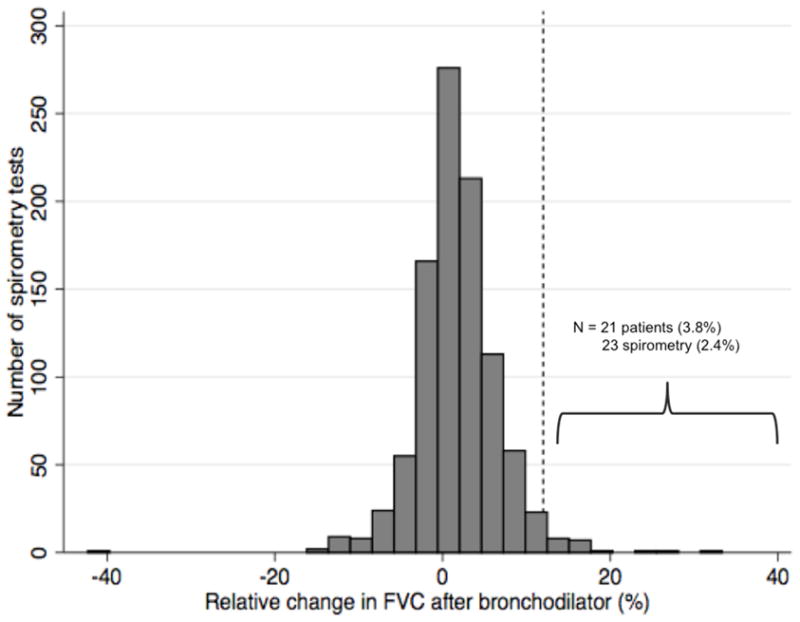
Figure 1.


Distribution of change in FEV1 and FVC with bronchodilator use
N = 967 unique spirometry tests with pre and post-bronchodilator measurements of FEV1 (a) and FVC (b). The dashed vertical line represents a 12% improvement in FEV1 or FVC following bronchodilator, corresponding to physiologic airflow limitation.
