Fig. 3.
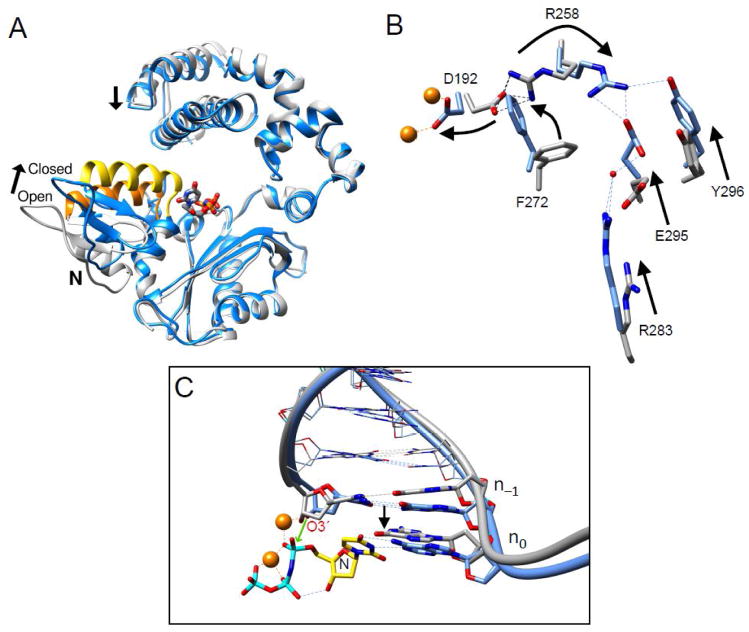
Conformational adjustments as DNA polymerase β transitions between open and closed conformations. (A) Ribbon representation of the pol β open DNA binary complex (gray) superimposed with the ternary (+dNTP) complex (blue). DNA is omitted for clarity, but the incoming nucleotide of the ternary complex is shown in a stick representation. The N-subdomain closes upon the nascent base pair upon formation of the ternary complex. This repositioning is indicated by the altered position of α-helix N (open conformation, orange; closed conformation, yellow). Concomitant with the closed conformation, the lyase domain also increases interactions with the N-subdomain. (B) The position of the N–subdomain can be monitored in the active site through a series of altered interactions between Asp192 (D192), that coordinate both active site metals (orange), and Arg283 (R283) that is situated in the N–subdomain. The arrows represent motions associated with the closing transition. N–subdomain closing is associated with Arg258 (R258) releasing Asp192 and forming hydrogen bonds with Glu295 (E295) and Tyr296 (Y296). Phe272 (F272) is repositioned in the closed complex to insulate Asp192 from Arg258. The DNA is omitted for clarity. (C) A view of the DNA major groove edge of the nascent base pair and primer terminus (O3′, stick representation) illustrating repositioning of the template strand and primer bases upon forming the closed ternary complex. The black arrow represent a shift in the template strand associated with the closing transition where the template strand moves toward the N–subdomain. Base pairs upstream of the primer terminus are illustrated in a wire representation. The polymerase is omitted for clarity. The incoming nucleotide (dUMPPNP) and its coding template base of the ternary complex are labeled N and n0, respectively. The green arrow illustrates the repositioned O3′ (labeled) attacking Pα of the incoming nucleotide. The catalytic and nucleotide magnesium ions are shown as orange spheres. Panels B and C were adapted from Beard et al. [29].

