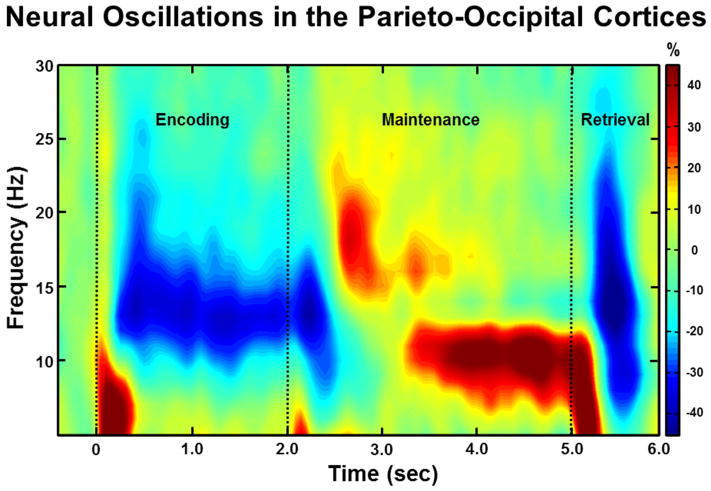
Figure 2.
Group-Averaged Time-Frequency Spectra During Encoding, Maintenance, and Retrieval Phases. Time (in ms) is denoted on the x-axis, with 0 ms defined as onset of the encoding grid. Frequency (in Hz) is shown on the y-axis. All signal power data is expressed as a percent difference from baseline (−0.4 to 0.0 s), with the color legend shown to the far right. Data represent a group-averaged gradiometer sensor that was near the parietal-occipital region in each participant (the same sensor was selected in each participant). As can be discerned, alpha/beta activity in this brain area strongly decreased (i.e., desynchronization) during the encoding phase, then shifted toward robust increases (i.e., synchronization) in a more narrow (alpha) band during the maintenance phase. Time periods with significant oscillatory activity (relative to baseline) were subjected to beamforming in 0.4 s non-overlapping time bins.

