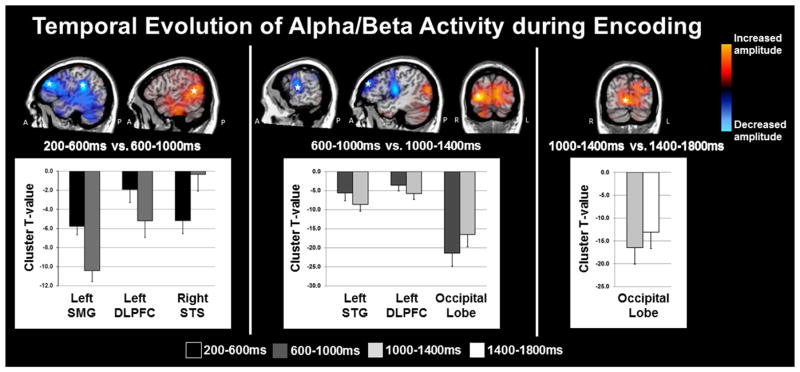
Figure 3.
Significant 9–16 Hz Oscillations during Encoding. Brain areas exhibiting significant changes in 9–16 Hz activity as a function of time are shown with red indicating increases in oscillatory power and blue showing decreases in power. For each cluster, the peak difference between time windows is denoted with a star on the top panel, and the t-values for the significant cluster (per time bin) are shown at the bottom. Note that the cluster t-values shown in the bar graphs were computed using a one-sample t-test on each time window, and are only meant to aid in interpreting the results of the paired-samples t-test; all p-values below were based on the paired-samples results. From Encoding 1 (0.2 – 0.6 s) to Encoding 2 (0.6–1.0 s), the amplitude of 9–16 Hz activity significantly decreased in the right superior temporal sulcus (STS; p < .001, corrected), while such activity significantly increased in the left DLPFC and supramarginal gyrus (SMG; both p’s < .001, corrected). From Encoding 2 to Encoding 3 (1.0–1.4 s), the amplitude of activity in bilateral occipital cortices increased toward baseline levels (p < .001, corrected), while the significant decrease in 9–16 Hz activity continued in the left DLPFC and emerged in the superior temporal gyrus (STG: p > 0.001, corrected). Finally, from Encoding 3 to Encoding 4 (1.4–1.8 s) the significant increase in 9–16 Hz activity continued in the bilateral occipital cortices (p < .001, corrected).

