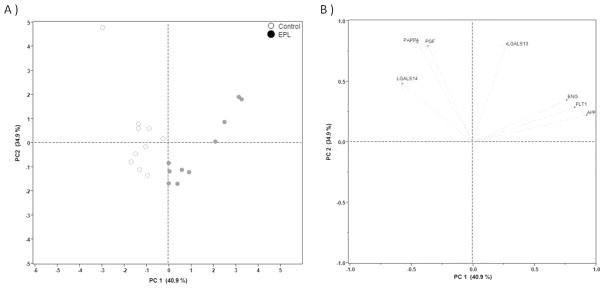
Figure 3.
Principal component analysis (PCA) plots. (A) PCA scores were calculated and plotted for individual patients over the first two principal components (PC1 and PC2). The PCA score plot demonstrates a separation of EPL (closed circles) and control cases (open circles). (B) The loading plot was generated for individual biomarkers to determine their relationships over PC1 and PC2. Two groups of factors composed of associated members (AFP, FLT1, and ENG; and LGALS14, PAPPA, and PGF) were identified by their positions along the x-axis. Note that LGALS13 did not cluster with the other proteins.

